ARTICLE
Market Recap: Strong First Quarter Recovery | First Quarter 2019
by: Smith and Howard Wealth Management
In a nutshell: Market segments and strategies that experienced the sharpest declines at the end of 2018 saw the largest advances at the close of March 2019. Why? It seems that concerns related to U.S. trade policy, Chinese economic growth, and the Federal Reserve subsided during the quarter, propelling investors to return to the same investments they’d so eagerly been fleeing only a few months before. The lone exception to this single-quarter upward trend was U.S. Investment-grade bonds, which posted positive returns in each of the last two quarters.
An In-Depth Look at the Market Through March 31, 2019
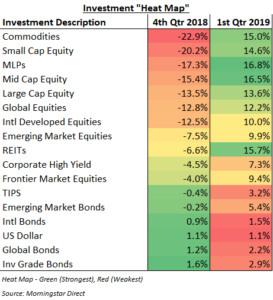
Looking at the returns of major asset classes and markets for the 1st quarter of 2019 we see a dichotomy in returns from the 4th quarter of 2018. The returns on asset classes and market segments are illustrated in the heat map below. Fourth quarter 2018 returns are sorted from worst (red) to best (green). The gradation of colors illustrates the variation within those red, yellow and green ranges. Returns for the same markets for the first quarter of 2019 are shown in the right column (not sorted by worst to best). With some minor exceptions, generally what fell the most during the 4th quarter reversed course and advanced the most during the 1st quarter of 2019.
While we have no details yet on a trade deal between the U.S. and China, the administration has indicated they are making good progress and that has helped ease investor fears on overall trade policy and Chinese growth, countering the weakness from the same areas during the 4th quarter of 2018. The Federal Reserve, perhaps sensing the error of their ways (or words), has completely changed course from their December rate hike announcement in which they spooked markets by signaling a willingness to continue with rate hikes in the new year. With concerns on each front waning, markets stabilized and then recovered much of the ground they’d lost in the prior three months.
Equities
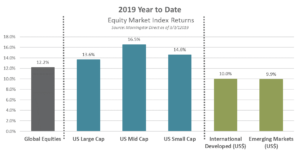
The story for equities has clearly been the strong rally that began in late December and carried into the new year. Coming on the heels of a precipitous selloff during the 4th quarter, the U.S. market has enjoyed its best quarterly gain in nearly 10 years and its best start to the year since 1998. As previously noted, investors seemed to take comfort in the progress made between the U.S. and China on trade, as well as the retooled message from the Fed. As our “heat map” indicated, the strongest gains were seen in the areas that had been hardest hit the prior quarter. U.S. stocks outperformed international developed and emerging markets, although each was up nearly double digits for the quarter.
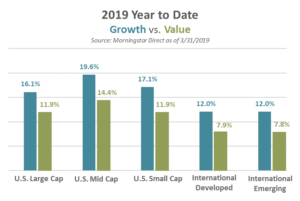
Led by strength in the technology sector (+19.9%), growth stocks handily outperformed value stocks during the quarter. As the Growth vs.Value graph illustrates this was irrespective of market cap or geography. We caution investors from reading too much into the comparison, however, as this followed along the same reversal theme we saw in broader markets. Value stocks had handily outperformed their growth counterparts during the 4th quarter, so are now giving back part of that prior period outperformance.
Bonds
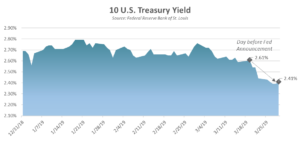
The 10-Year U.S. Treasury yield graph shows that the bond market experienced a rather uneventful period up until the final two weeks of the quarter when things quickly changed. Prior to those last two weeks, the yield had stayed in a fairly narrow range between 2.6% and 2.7%. All that changed, however, on March 20th when the yield began a steep drop from 2.61% to the 2.41% where it ended the quarter. The drop was a result of the Federal Reserve’s communication that same day in which they effectively downgraded their economic growth forecasts and reduced their 2019 rate hike guidance from two to none. Investors may have anticipated some softening of the Fed’s stance on future hikes, but clearly, the announcement caught many by surprise.
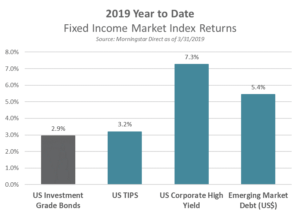
Lower interest rates and yields do result in pushing bond prices higher, so bond returns for the quarter were strong. As bond investors know, however, what was a tailwind for returns during the past quarter may become a headwind for future returns.
While more opportunistic or credit sensitive areas of the bond market also did well during the quarter, they followed a very different path to those results. More opportunistic areas saw returns early in the quarter as investors returned to the equity market and more credit sensitive assets. Investors started to express some credit related concerns later in the quarter, but those concerns were partially offset by the overall lower yield environment.
Real Assets – Commodities and REITS
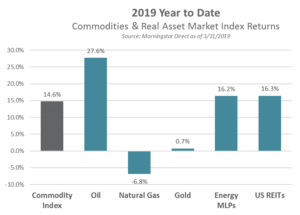
Commodities and real estate related investments (REITs) saw some of the biggest reversals from the prior quarter. These markets had seen some of the larger percentage declines during the 4th quarter of 2018, but are now seeing some of the most impressive rallies in early 2019. This is not uncharacteristic of commodities and real estate as they tend to be both volatile and economically sensitive. As economic concerns drove the 4th quarter selloff, they were perhaps disproportionately targeted by sellers. REITs also tend to be rather sensitive to interest rates and the recovery in that market segment was further aided by the late-quarter drop in interest rates.
With questions on this recap, contact Brad Swinsburg 404-874-6244.
Explore more information on the first quarter of 2019 by visiting these links:
Market Outlook: First Quarter 2019
On the Horizon: First Quarter 2019
A Deeper Dive: First Quarter 2019
Unless stated otherwise, any estimates or projections (including performance and risk) given in this presentation are intended to be forward-looking statements. Such estimates are subject to actual known and unknown risks, uncertainties, and other factors that could cause actual results to differ materially from those projected. The securities described within this presentation do not represent all of the securities purchased, sold or recommended for client accounts. The reader should not assume that an investment in such securities was or will be profitable. Past performance does not indicate future results.

Subscribe to our newsletter to get inside access to timely news, trends and insights from Smith and Howard Wealth Management.
 Back to Insights