ARTICLE
A Deeper Dive: Return Potential of Rebalancing
by: Smith and Howard Wealth Management
In a nutshell: Portfolio rebalancing is often thought of and presented to clients as a means for managing risk in a portfolio. And though it certainly plays an important risk management role, we believe that the added return potential from a thoughtful, consistent rebalancing process is underappreciated and something investors should look to capture. Investment returns are highly cyclical and a rebalancing process that encourages investors to add to underperforming assets while reducing outperforming ones can be additive to long-term returns.
The Power of Rebalancing (First Quarter 2019)
We find that while most advisors talk about rebalancing and clients typically understand it in concept, there is a general lack of appreciation by both groups for the benefit and “power” of rebalancing.
In investment portfolio management, rebalancing refers to the actions (trades) that a portfolio manager may take to return a portfolio to its original or targeted allocation. As an example, an investor could target a very simple portfolio that consists of 60% of the money in stocks and 40% in bonds. That “60/40” mix is relatively common and easy to implement in such a manner, but market fluctuations after the initial trades will inevitably result in deviations from that target mix. For instance, when stocks appreciate it can lead to the equity portion of the portfolio increasing to something greater than the 60%. Such an “overweight” or deviation over time can become sizeable and result in a portfolio with a very different risk/reward profile than what the investor originally intended. Risk management, however, is not the only reason or benefit to result from rebalancing a portfolio. As we’ll show in the following example, rebalancing can also lead to greater long-term investment results, a benefit that is often underappreciated.
Let’s return to that same 60/40 portfolio mix. For purposes of our example, we’ll use the returns of the S&P 500 Index to represent the 60% in stocks and the U.S. BarCap Aggregate bond index for the 40% invested in bonds. We’ll also assume a very simplistic annual rebalancing, meaning that the portfolio will start every year with that same 60/40 mix. As the table below illustrates, a simple rebalancing approach can produce impressive results.
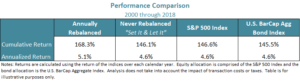
In terms of demonstrating the “power” of rebalancing, this is frankly about as good as it gets. The annually rebalanced portfolio returned a cumulative 168.3% or 5.1% per year. That compares to the never rebalanced portfolio, something we’ve termed “Set It & Let It”, of just 146.1% or 4.6%. Though half of a percent may not seem like a large differential on an annualized basis, consider that
1) compounded over 19 years it is significant (see cumulative returns)
2) it is greater than either of the individual indices on their own and
3) is being achieved with a very simplistic, once a year rebalancing
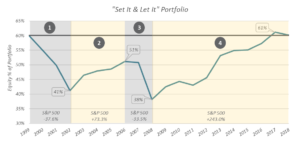
Every rebalancing will play out differently, but our simple 60/40 portfolio example is a great case study for investors wanting to understand just how impactful rebalancing can be and how it plays out over time. Rather than focusing on the rebalanced portfolio and its returns, we believe we can best illustrate the benefits of rebalancing by focusing on what happened to the portfolio that was never rebalanced. While the rebalanced portfolio started each calendar year with that 60/40, stock/bond mix, the never rebalanced portfolio started each year with a different mix that was typically very far removed from its original 60/40 allocation. That year-by-year deviation in the mix of assets is ultimately what results in the “Set It & Let It” portfolios’ underperformance.
In the “Set It & Let It” graph below, you can see the % of the portfolio invested in equities at the outset of each calendar year. The portfolio may have started the period at 60%, but it spent almost the entire timeframe below that level. We have divided the graph into four distinct and notable time periods, each of which we’ve provided some thoughts on below the graph.
In our rebalancing simulation, we purposefully chose to keep things high-level with a simple rebalancing methodology (annual). This allows us to emphasize that rebalancing works, not because of any complex, hard to understand process, but because investment returns are highly cyclical and rebalancing forces investors to buy underperforming assets and sell outperforming ones. That may sound reasonable and logical, but it is often very hard for investors to execute upon. Having a thoughtful, consistent rebalancing process in place is critical to capturing the added value that systematic rebalancing can create. We may not be able to control what markets do, but we can plan for and control how we react to them.
Though this rebalancing example was obviously effective in generating desirable results, it is far from the only method or area of the portfolio in which rebalancing can add value for investors. In future articles, we’ll detail how we, as a firm, approach rebalancing and look to augment the process and results through our valuation work.
Contact Brad Swinsburg to learn more about the “power” of rebalancing, 404-874-6244.
Explore more information on the first quarter of 2019 by visiting these links:
Market Recap: First Quarter 2019
Market Outlook: First Quarter 2019
On the Horizon: First Quarter 2019
Unless stated otherwise, any estimates or projections (including performance and risk) given in this presentation are intended to be forward-looking statements. Such estimates are subject to actual known and unknown risks, uncertainties, and other factors that could cause actual results to differ materially from those projected. The securities described within this presentation do not represent all of the securities purchased, sold or recommended for client accounts. The reader should not assume that an investment in such securities was or will be profitable. Past performance does not indicate future results.

Subscribe to our newsletter to get inside access to timely news, trends and insights from Smith and Howard Wealth Management.
 Back to Insights