ARTICLE
Market Outlook – Broad U.S. Markets Remain Relatively Expensive | Third Quarter 2018
by: Smith and Howard Wealth Management

In a nutshell: Broad U.S. markets remain relatively expensive. Bond valuations and future expectations have improved marginally as yields have crept higher. Compared to bonds, equities are somewhat expensive, but at a level which still indicates they can outperform bonds over a full business or market cycle. International equities, developed and emerging, offer a compelling, current opportunity for investors willing to reduce their natural home country bias (Fighting the Home Country Bias). Diversification away from traditional U.S. assets and strategies remains a key component to our strategy.
For an in-depth look at the big picture, read below.
The Big Picture
The big picture for Smith and Howard Wealth Management is always going to be framed by valuations (see our previous article “Why Valuation Matters”). As long-term investors, we recognize that while it is interesting to speculate and debate about near-term events and breaking news, ultimately, investment returns are driven by valuations. Shifting portfolios towards cheap assets and away from expensive ones “wins” over time. It not only generates a higher long-term return, but typically results in smaller drawdowns or losses along the way. It’s the amazingly simple, but difficult to execute philosophy of “buy low, sell high.”
Bond Outlook Improves Again, Albeit Very Slowly
As we detailed in our Deeper Dive section of the 1st Quarter CFO Report A Deeper Dive – The Impact of Rising Interest Rates, the increase in bond yields has many ramifications for investors. One ramification is that it is likely to dampen or even turn bond returns negative for investors as higher yields mean lower bond prices (as it has done this year). A more positive ramification of those higher rates is that bond investors may expect higher future expected returns. Bond yields are still at relatively low levels, but the picture slowly continues to improve for future returns (again, at the expense of current returns). As the chart below (Change in Yield Curve) shows, U.S. Treasury yields increased again for all maturities for the quarter.
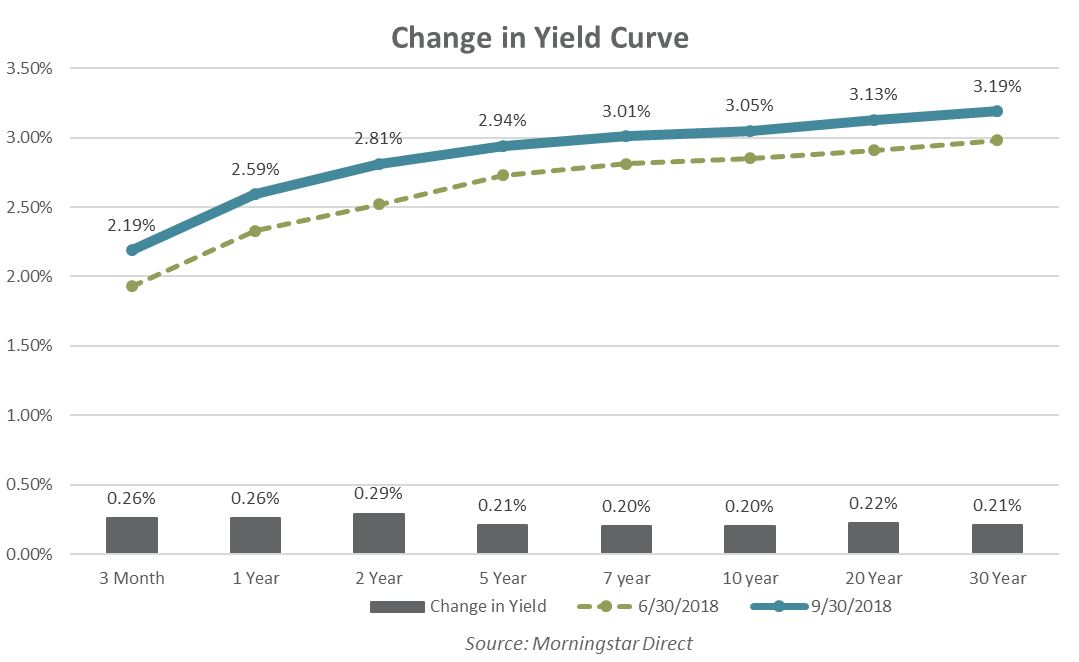
The chart also shows the yield curve is still “positive” or normal. This means that investors expect to earn a higher yield on bonds the longer the time until maturity. In our illustration, that means the curve slopes upward from left to right. This slope is being closely watched on Wall Street, as an “inverted” or downward sloping curve has historically signaled that we are nearing an economic recession. Specifically, it is the yield difference between the 10-Year U.S. Treasury and the 2-Year U.S. Treasury. As we can see from the graph, the 10-Year still yields 0.24% more than the 2-Year. There has been a growing expectation that the yield curve will eventually invert, but shifts in the yield curve this year have been more parallel in nature (i.e. the whole curve has shifted in the same direction and similar magnitude). Just because short-term rates move higher does not guarantee that the curve will invert.
The picture in more opportunistic segments of the bond market has not changed markedly and would still be characterized as expensive. Credit spreads for corporate bonds remain tight and even though they offer additional yield pickup it is hard to call them a bargain at current valuations. One exception would be within emerging markets. Emerging market debt recovered somewhat during the quarter, but on the year remains one of the poorest performing areas of fixed income. We do not currently have an allocation to emerging market debt, but it is something we continue to monitor with an eye towards allocating capital if yields were to become attractive enough.
Equities – Where Are Investors Being Adequately Compensated Today?
Last quarter we devoted a significant portion of this section to defining the Equity Risk Premium or ERP. The ERP is a valuation measure gauging the level of “extra” return investors expect above what they could earn investing in fixed income. Rather than trying to identify a “correct” ERP (no such figure exists) it may be used as an indicator of investors’ current appetite for risk. The lower the ERP, the lower the “extra” return expected and the higher the risk being accepted by equity investors (and vice versa).
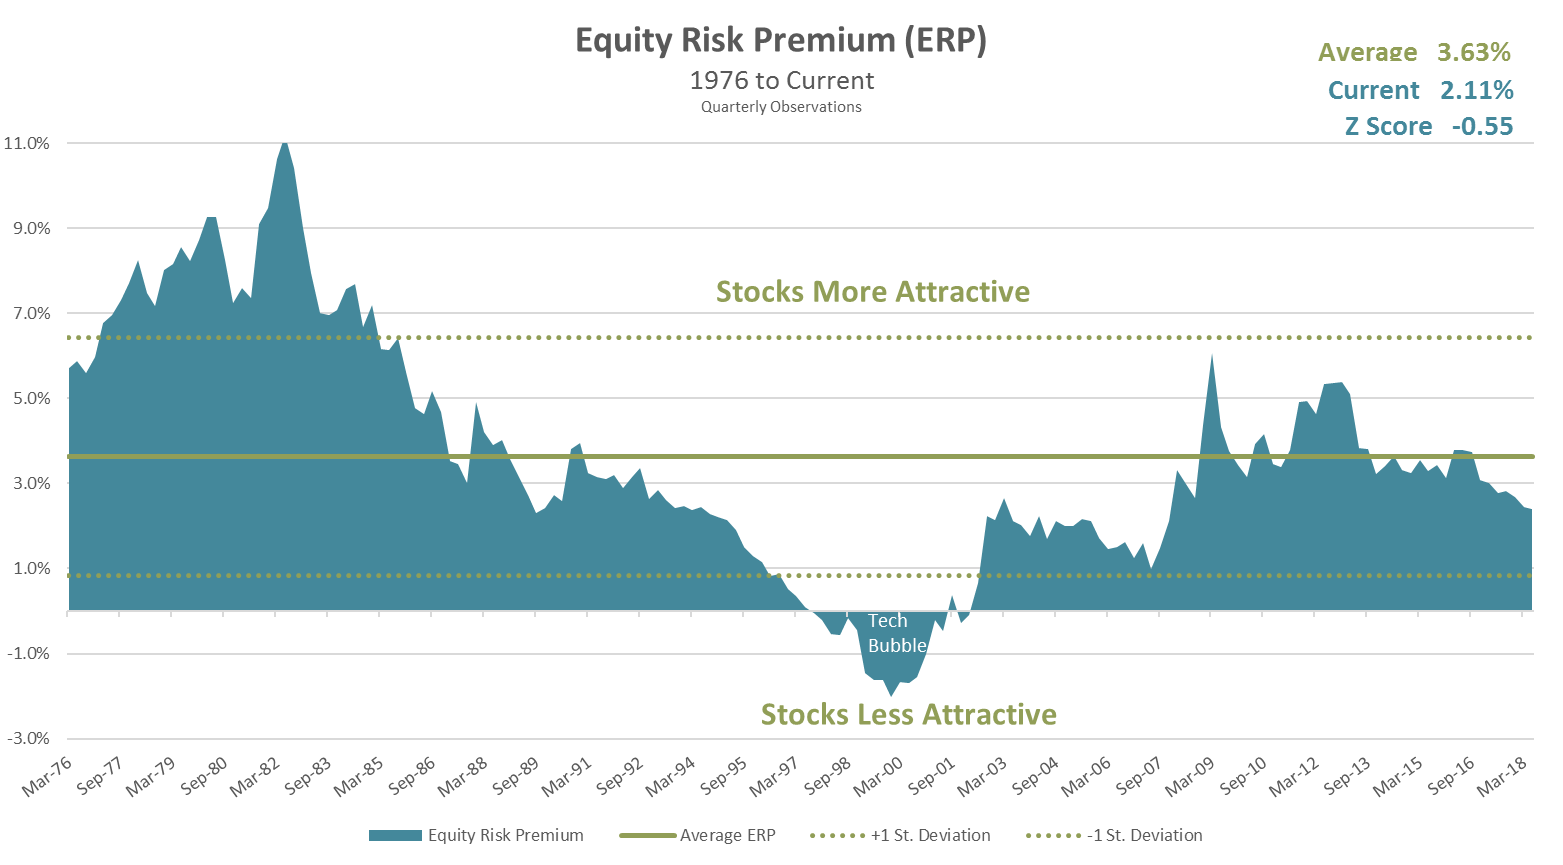
The Equity Risk Premium chart shows the ERP over time (blue area) for U.S. large cap equities and illustrates that risk appetites are currently high (risk premium is low). Said another way, investors are not demanding as much “extra” return as they have historically when compared to the average (solid green line). On average the ERP has been 3.63%, but today investors are demanding “only” 2.11%.
As noted above and in the prior CFO Report, this reading is specific to the U.S. and Large Cap stocks (S&P 500). SHWM runs a globally diversified program, however, so naturally we look beyond our own borders to gauge the attractiveness of other markets. Today, we believe both international developed and emerging market equities offer a compelling opportunity. We believe investing in international equities today extends beyond the basic diversification benefits that might typically be the rationale for investing abroad. Valuations in international developed and emerging markets are more attractive than those found in the U.S.
As we’ve discussed previously, our philosophy, outlook, and allocations are driven by valuations. Our valuation work and the below graph compares the relative attractiveness of various major markets across the globe.
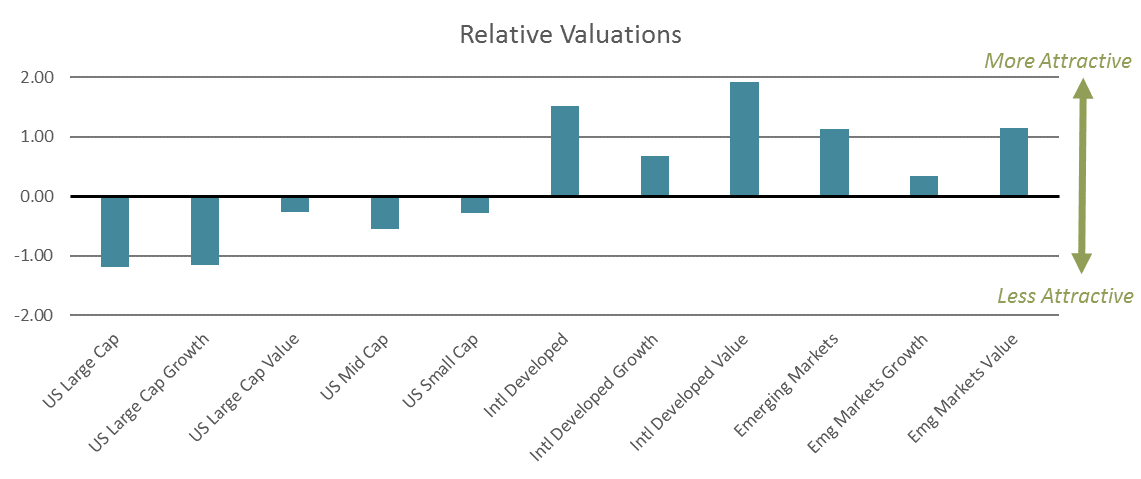
Scores greater than 0 present a more compelling opportunity and scores below 0 a less compelling opportunity. The further away from 0, the greater the relative opportunity. As the above shows, U.S. markets are all on the more expensive side of 0, while International Markets, Developed and Emerging, are above 0. This would indicate that U.S. equity markets are the least compelling across the globe, whereas international markets, namely developed value and emerging value, are the most compelling.
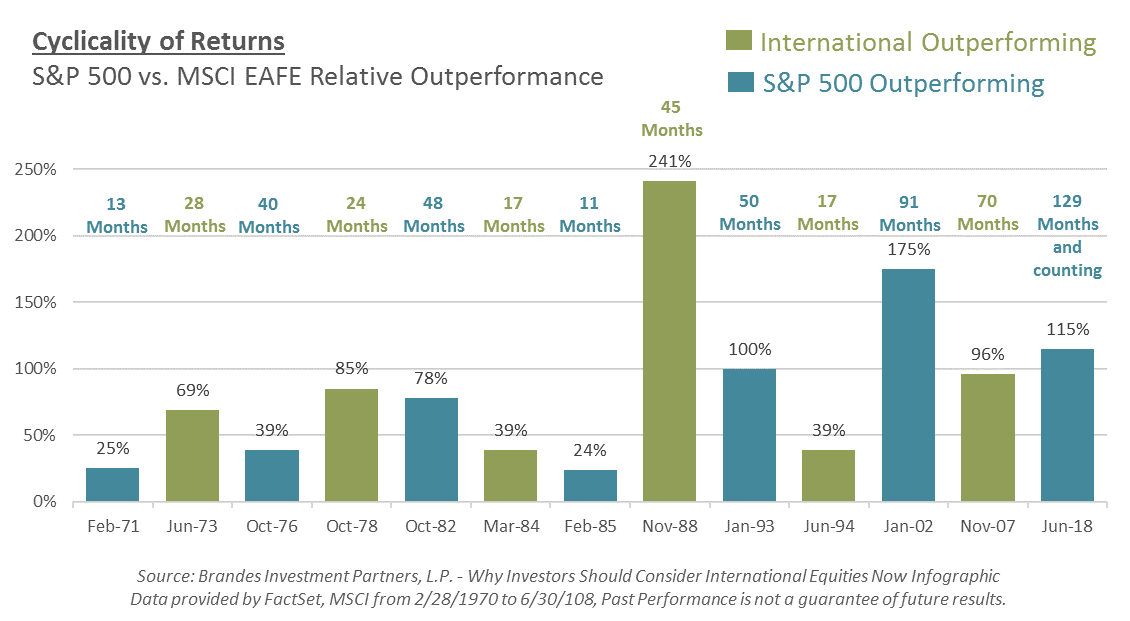
We recognize that there are plenty of reasons investors remain reluctant to sell their U.S. equities to invest abroad. In addition to concerns about tariffs and geopolitical drama, the S&P 500 has outperformed the international markets considerably since the financial crisis. As the graph below illustrates, the current period of U.S. outperformance is the longest such streak on record. What this graph also illustrates is how cyclical this dynamic is. While it is understandable that investors might look at the last 10 years and assume the U.S. is simply a better place to invest, a lengthier time perspective would indicate that the outperformance is unlikely to continue indefinitely.
The more expensive an investor’s home market becomes the more willing an investor must be to seek opportunities outside of those markets. While this may seem like a simple, logical statement, it is also extremely difficult to execute. Expensive markets are typically expensive because they have outperformed (and vice versa) and selling an outperformer to buy an underperformer is never easy. It is made even more difficult when an investor is moving from something familiar and comfortable to something foreign (pun intended!). Our process and focus on valuation is intentionally designed to help remove many of the emotional hurdles that derail investors and it is why we continue to believe in the value of international markets.
To learn more about why we feel shifting portfolios towards cheap assets and away from expensive ones “wins” over time, contact Brad Swinsburg 404-874-6244.
Explore more information on the third quarter of 2018 by visiting these links:
Market Recap: Third Quarter 2018
On the Horizon: Third Quarter 2018
A Deeper Dive: Third Quarter 2018
Unless stated otherwise, any estimates or projections (including performance and risk) given in this presentation are intended to be forward-looking statements. Such estimates are subject to actual known and unknown risks, uncertainties, and other factors that could cause actual results to differ materially from those projected. The securities described within this presentation do not represent all of the securities purchased, sold or recommended for client accounts. The reader should not assume that an investment in such securities was or will be profitable. Past performance does not indicate future results.

Subscribe to our newsletter to get inside access to timely news, trends and insights from Smith and Howard Wealth Management.
 Back to Insights