ARTICLE
A Deeper Dive: Using Valuations to Enhance Rebalancing Process | Second Quarter 2019
by: Smith and Howard Wealth Management
In a nutshell: In addition to helping manage investment risk, a thoughtful, well-designed portfolio rebalancing process has the potential to improve returns. As valuation-oriented investors, we believe that incorporating valuation signals into our rebalancing process is a powerful differentiator that allows us to capture relative differences in investment returns. Not every market fluctuation is worth pursuing, however, so our valuation works focuses on identifying meaningful opportunities, or valuation outliers.
The Power of Rebalancing
Last quarter, we illustrated how a simple, but consistent portfolio rebalancing approach has the ability to help manage portfolio risk and add to performance. In this quarter’s Deeper Dive, we expand on that concept by detailing why and how we incorporate valuation signals into our allocation and rebalancing processes.
At Smith and Howard Wealth Management we believe that valuation is the primary driver of relative differences in investment returns over time. To capture those relative differences, we must incorporate valuations into how we allocate capital. Past readers understand our perspective on the importance of valuation in investing. If you’d like a refresher, read here or here. The focus of this installment is on how we use valuations in our allocation process to tilt portfolios towards that which valuations indicate are cheap and away from what they deem expensive.
We’ll look at a real-world example to illustrate the potential value of such an approach, focusing on two segments of the U.S. equity market: U.S. Large Cap Growth and U.S. Large Cap Value. These segments tend to make up a majority of most investors’ equity portfolios. The typical “mix” or split between Growth and Value market segments for most investors is 50/50, but our example will show that an investor could have increased their returns by tactically altering that mix over time using valuation signals.
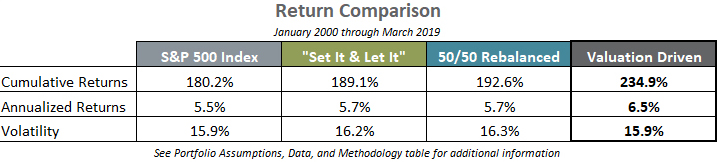
In the performance table that follows, we compare the returns of the S&P 500 with three hypothetical portfolios. Those portfolios were constructed with the same underlying holdings, but used different approaches to managing the mix between growth and value. We have detailed the construction of each of these hypothetical portfolios in the Portfolio Assumptions, Data, and Methodology section. The methodology used in the Valuation Driven portfolio has been simplified for the example but is consistent conceptually with our actual process.
As you can see, the portfolio on the right, which used valuations to shift the portfolio growth/value mix over time, resulted in the best performance and equal or lower volatility. In this example, valuations provided a powerful signal to investors that led to improved results.
While the total period outperformance of the valuation-driven portfolio is attractive, it also obscures some important observations that can be noted by looking at the portfolio shifts over time. Using this approach would have understandably resulted in a value overweight (growth underweight) during the tech bubble and then the opposite positioning after the financial crisis. Given what we now know about both periods, neither should be a surprise. What does surprise investors is that the information needed to make both determinations was available at the time. Most investors, however, ignored the valuation signals and the opportunity they had created. Engaging a knowledgeable investment advisor, who is more apt to understand such information and trends, considerably increases ones’ ability to avoid major mistakes and seize opportunities.
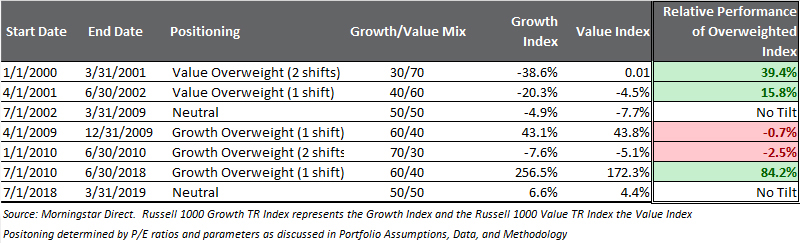
As the table shows, not every shift added to returns or added to returns immediately. In those instances, performance differentials were negative, but also relatively small. When the differentials were meaningful, however, they heavily favored the valuation-oriented investor and resulted in significant outperformance over lengthy periods of time. The growth overweight that began in early 2009 was “wrong” for well over a year, but very “right” for the next eight years. This is yet another example of why patience is important and why valuation-based investing shouldn’t be thought of as a market timing tool.
Portfolio Shifts – Searching for the Outliers
The results of our simple study speak for themselves and can be repeated by looking at other time periods and markets. For the patient investor, valuation matters. The process by which an investor thinks about and uses valuation also matters.
When we analyze market valuations for potential opportunities, we are strictly looking for outliers. Markets and valuations are constantly changing, but not every fluctuation is worth pursuing or trying to capitalize upon. Think about the highway patrol officer parked along the highway with a radar gun. As cars whiz by, the radar gun will surely show that very few, if any, cars are going exactly the speed limit. Most will hopefully be a few miles under the speed limit, while some will even be a bit over. Neither are really of any interest or what the officer is there for. The officer is there to catch the outlier, the driver doing 95 mph in a 60 mph zone. Like the highway patrol, rather than chase every small valuation discrepancy we focus on trying to find outliers or data points that differ significantly from other, more normal observations. By focusing on these outliers, we believe we will increase our probability of success, as well as reduce things like trading costs and taxes that can add up when advisors try to trade more frequently.
While experience and judgement play a factor in any process, our use of valuation in identifying outliers means we are primarily data or numbers driven. There are two benefits to such an approach. The first is that the all too often negative influence of emotions in the investment decision making process is minimized. The second is that what “qualifies” as an outlier is not subjective. Because a data set can be described in terms of things like its average, mode, standard deviations, skew, kurtosis, etc…. what qualifies as an “outlier” becomes a matter of calculation. We typically define anything greater than +/- one standard deviation as an outlier. It is outliers identified in this manner that drives our investment process and decisions.
That person driving 95 mph is unquestionably well over the speed limit and worth pursuing. That is a good analogy for how we approach making allocation shifts. We are content to stick with our long-term, strategic allocation, unless or until an outlier presents itself. When such an opportunity races into view, we – like the patient highway patrol officer – must be ready to act.
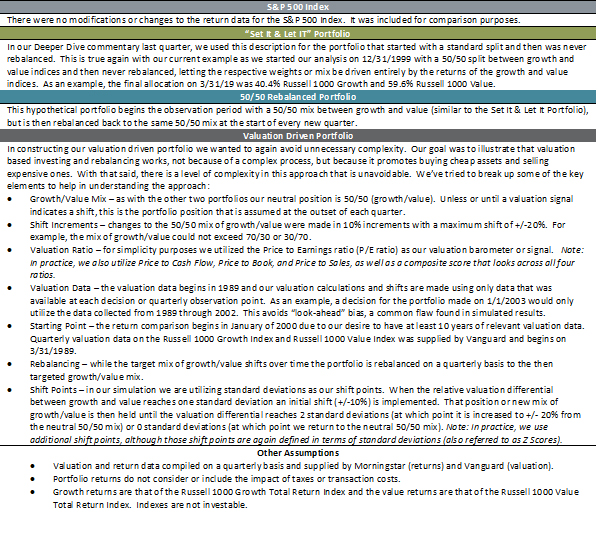
Portfolio Assumptions, Data, and Methodology
We understand that hypothetical or simulated results will be (and should be) viewed with a healthy dose of skepticism. The assumptions and details incorporated into such exercises matter tremendously. As detailed in the following table we attempted to minimize the number of assumptions and keep things simple whenever possible.
Contact Brad Swinsburg 404-874-6244 to learn more about the power of rebalancing and Smith and Howard Wealth Management’s approach.
Explore more information on the second quarter of 2019 by visiting these links:
Market Outlook: Second Quarter 2019
Market Recap: Second Quarter 2019
On the Horizon: Second Quarter 2019
Unless stated otherwise, any estimates or projections (including performance and risk) given in this presentation are intended to be forward-looking statements. Such estimates are subject to actual known and unknown risks, uncertainties, and other factors that could cause actual results to differ materially from those projected. The securities described within this presentation do not represent all of the securities purchased, sold or recommended for client accounts. The reader should not assume that an investment in such securities was or will be profitable. Past performance does not indicate future results.

Subscribe to our newsletter to get inside access to timely news, trends and insights from Smith and Howard Wealth Management.
 Back to Insights