ARTICLE
On the Horizon: COVID-19 and the Market Impact
by: Smith and Howard Wealth Management
It is painfully clear that the coronavirus, COVID-19, is by far the most important issue impacting markets (and our world as a whole) today. Thus, you’ll find that the entirety of this portion of Your Family’s CFO Report is concentrated on the economic and financial market implications surrounding the pandemic.
This isn’t to say that the oil price war between the Saudis and Russians or the upcoming U.S. elections aren’t important, only that for the time being they remain secondary.
Economic Implications: The Decline in GDP
Efforts being made across the globe to contain the spread of the virus will undoubtedly have an impact on global GDP. Asia, specifically China, will see a significant impact in the 1st quarter, but it is anticipated that the U.S., Europe, and other regions more recently affected will see 2nd quarter numbers most affected. It is extremely difficult to quantify what the overall impact may be, but some estimates in the U.S. have indicated that the annualized decline in GDP for the 2nd quarter could be as much as 20-30% (more on what this means in a moment). Economists are admittedly guessing with such figures, given that the typical economic models don’t account for prolonged periods where large segments of the economy are basically suspended. Estimates beyond the 2nd quarter vary even more significantly depending on how long one believes the world may be fighting to contain the virus.
The magnitude of the economic impact may remain uncertain for the next few months, but even rough estimates allow us to make some comparisons to the reaction by equity markets. For rough numbers, the U.S. economy is a little over $20 trillion. When economists talk about a drop of 20-30% during the 2nd quarter they are using an annualized rate. So, the actual economic impact in the coming quarter is not 20-30% of $20 trillion, but one-quarter of that or 5-7.5%. In dollar terms that means that the lost economic activity could be around $1 trillion to $1.5 trillion during the 2nd quarter.
Any figure in the trillions is clearly significant, but let’s compare those figures to the massive drop in the equity market. The market capitalization (the collective equity value) of the S&P 500 at the end of 2019 was roughly $28 trillion. With the S&P 500 closing lower by -19.6% during the quarter, that means that the collective value of just these 500 companies dropped by approximately $5.5 trillion. Keep in mind that the U.S. GDP figure we cited was for the entire country, not just that of the companies that make up the S&P 500.
Without knowing how long we’ll be working to contain the virus or the toll that a temporary economic shutdown will cause, it is impossible to know if markets have overreacted. It does appear though that markets are pricing with a very pessimistic outlook.
Market Liquidity
A Need to Sell
One reason that markets may appear to be pricing in a rather pessimistic outcome is that many of the transactions over the last few weeks were not based on an assessment of a securities value. They were driven less by the want to sell and more by a need to sell.
During periods of persistent equity market weakness, there is usually a crossover point or event that causes selling to switch from orderly to disorderly. In hindsight, the crossover point this time appears to have come on Monday, March 9th. Over the weekend of March 7th and 8th it became clear that Saudi Arabia and Russia were entering into an oil price war. While equity markets had been weak since setting an all-time high on February 19th, there was a notable increase in the level of volatility and negativity when markets opened that Monday. The weakness and negative returns to that point had been concentrated in pro-cyclical investments such as stocks and commodities. Defensive investments, like high quality bonds and gold, had benefitted over the same period as investors sought their perceived safety. As the following graph shows, that dynamic changed on March 9th.
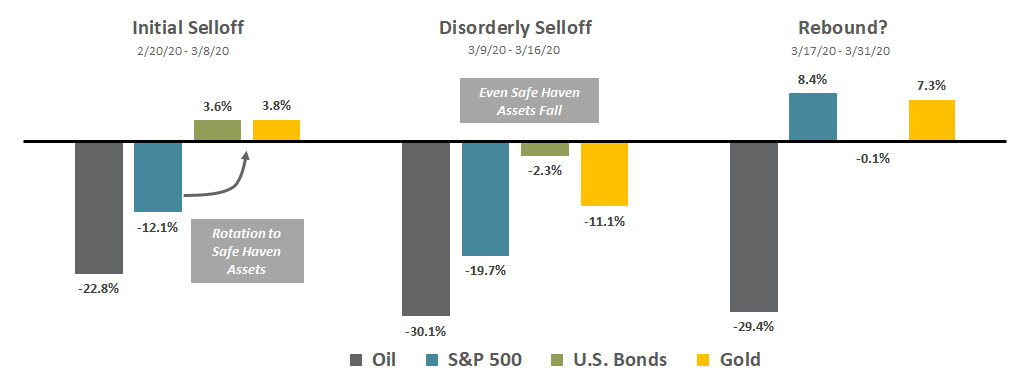
Rush to Cash
Rather than moving between different types of investments, the rush to cash began. Normal safe havens like investment grade bonds and gold fell right alongside equities and oil. The “run on the bank” had in a sense begun and unfortunately when that happened it created a snowball effect.
Market “liquidity” (the ability or ease at which an investment or asset can be readily converted to cash without affecting its market price) dried up everywhere. Companies tapped available credit lines in the banking system, which forced banks to sell securities and reduce trading limits at the same time that asset management firms were attempting to sell securities to meet investor redemptions. Selling begets more selling until something turns the tide.
We can’t know yet if the lows reached on March 23rd will have been the market “bottom”, but if that ends up being the case the “something” that turned the tide will likely have been a combination of anticipated monetary and fiscal stimulus. This crisis needs a medical solution, but for now, investors appeared to be encouraged by indications that governments around the world were willing to do “whatever it takes” to keep the financial markets functioning.
Markets Bottom at Maximum Pessimism
Every bear market selloff is distinct and this one is no exception. We would politely disagree, however, with those who believe that comparing the current selloff with others throughout history can’t provide valuable insight or perspective. As the saying goes, history doesn’t repeat itself, but it often rhymes.
Prior periods of crisis have shown that markets historically bottomed well before the worst of the news or consequences have occurred. We all anxiously await the point at which we see the number of active COVID-19 cases start to fall in the U.S. and abroad, but if history is any guide investors shouldn’t wait for that to occur before adding to stocks or risk assets. To paraphrase famed investor Sir John Templeton, markets bottom at the point of maximum pessimism. Given that markets are anticipatory, that point of maximum pessimism for investors typically occurs before the data or news gives the “all clear” signal. Let’s look at a few past examples.
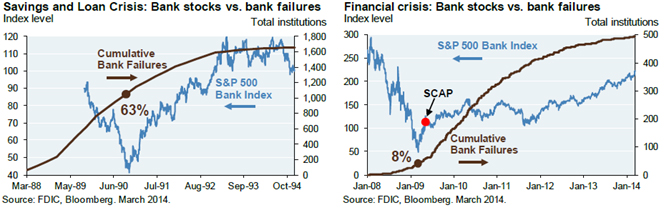
Bank Failures
Banks suffered significant casualties during both the Savings and Loan Crisis and the Great Financial Crisis (GFC). As the accompanying graphs show, the S&P 500 Bank Index (blue line) bottomed well before the number of cumulative bank failures (brown line) had peaked or were even starting to accelerate in the case of the GFC.
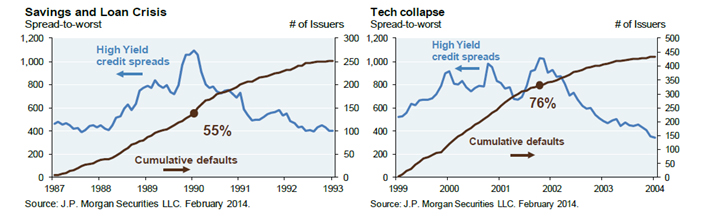
High Yield Credit Spreads
High Yield credit spreads are another barometer that investors closely watch during periods of market dislocation to try and judge when markets may have overshot on the downside. The higher the high yield spread (blue line) the greater the yield of those bonds relative to U.S. Treasuries and their perceived risk. As the accompanying charts show, for the S&L Crisis and the Tech collapse, high yield spreads peaked long before the same could be said for the number of cumulative bond defaults (brown line).
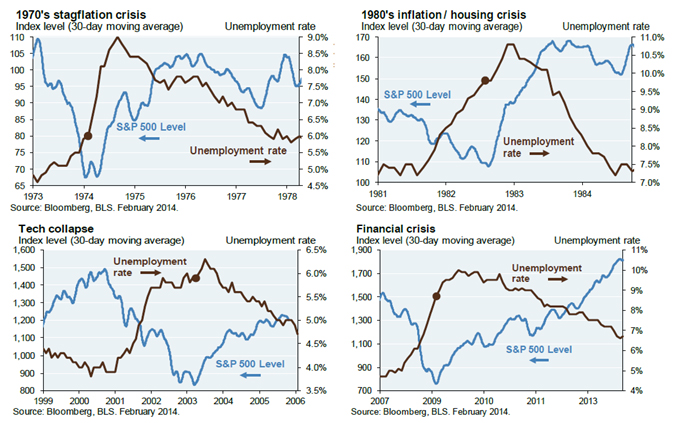
Unemployment Rates
Due to the abrupt nature of the economic shutdown, we have already seen a massive increase in the number of unemployment claims, so perhaps the most relevant historical reference pertains to past market bottoms and the unemployment rate. Four periods are reflective of this: the 1970’s stagflation, 1980’s inflation/housing crisis, the Tech collapse and the Financial Crisis. In each case, the graphs show again, the market (blue line) bottoms well before we’ve seen the peak in the Unemployment Rate (brown line).
We certainly won’t disagree with the argument that there are aspects of the current market and economic environment that are truly different. The catalyst and the specifics during such times always are. What we do believe will again prove true is that markets will reach a point of maximum pessimism before we see proof that the worst of the pandemic has passed.
Contact Brad Swinsburg 404-874-6244 if you would like more insight on the economic and financial market implications surrounding the pandemic.
Explore more information on the first quarter 2020 by visiting these links:
Market Recap + Outlook: First Quarter 2020
Unless stated otherwise, any estimates or projections (including performance and risk) given in this presentation are intended to be forward-looking statements. Such estimates are subject to actual known and unknown risks, uncertainties, and other factors that could cause actual results to differ materially from those projected. The securities described within this presentation do not represent all of the securities purchased, sold or recommended for client accounts. The reader should not assume that an investment in such securities was or will be profitable. Past performance does not indicate future results.

Subscribe to our newsletter to get inside access to timely news, trends and insights from Smith and Howard Wealth Management.
 Back to Insights