ARTICLE
Market Recap + Outlook | An In-Depth Look at the 1st Quarter of 2020
by: Smith and Howard Wealth Management
It seems hard to fathom, but it was only a little over a month ago on February 19th, that the S&P 500 closed at a new all-time high. At that point a few Asian markets and commodities had shown some coronavirus related weakness, but there was little hint at the level of volatility and fear (not to mention the changes to everyday life) that would grip the globe in the coming weeks. After hitting the aforementioned high, cracks in the equity market began to almost immediately emerge as the S&P 500 proceeded to drop for seven straight trading days. All told the global equity market (the MSCI All Country World Index) would fall -23.5% from that February 19th date and -21.4% for the quarter. As the following table/heat map shows, weakness for the quarter and especially since February 19th, was not limited to equities. Even traditional safe haven assets, investment grade bonds and gold, suffered. As the old investing expression goes “cash was king”.

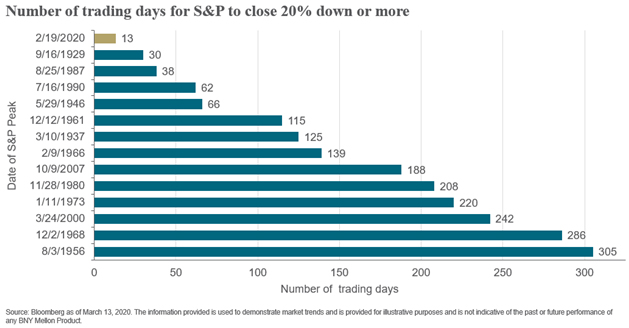
The level of volatility experienced by investors during the course of late February/early March was truly historic. It took just 13 days for the S&P 500 to reach bear market territory (defined as a 20% or greater drop from a prior high) a full 17 days faster than the previous record set during the Great Depression.
Equity markets didn’t hit their lowest point of the quarter until March 23rd, but the level of volatility reached its peak on March 16th as the S&P 500 closed down nearly 12% in just a single day. As we’ll discuss in greater detail in the On the Horizon section, market liquidity and returns began to improve towards quarter-end as promises by the government to do “whatever it takes” in the form of monetary and fiscal stimulus began to ease investor fears. Despite this improvement, the S&P 500 still had its worst quarter since the 4th quarter of 2008 and its worst 1st quarter since 1938.
Equities
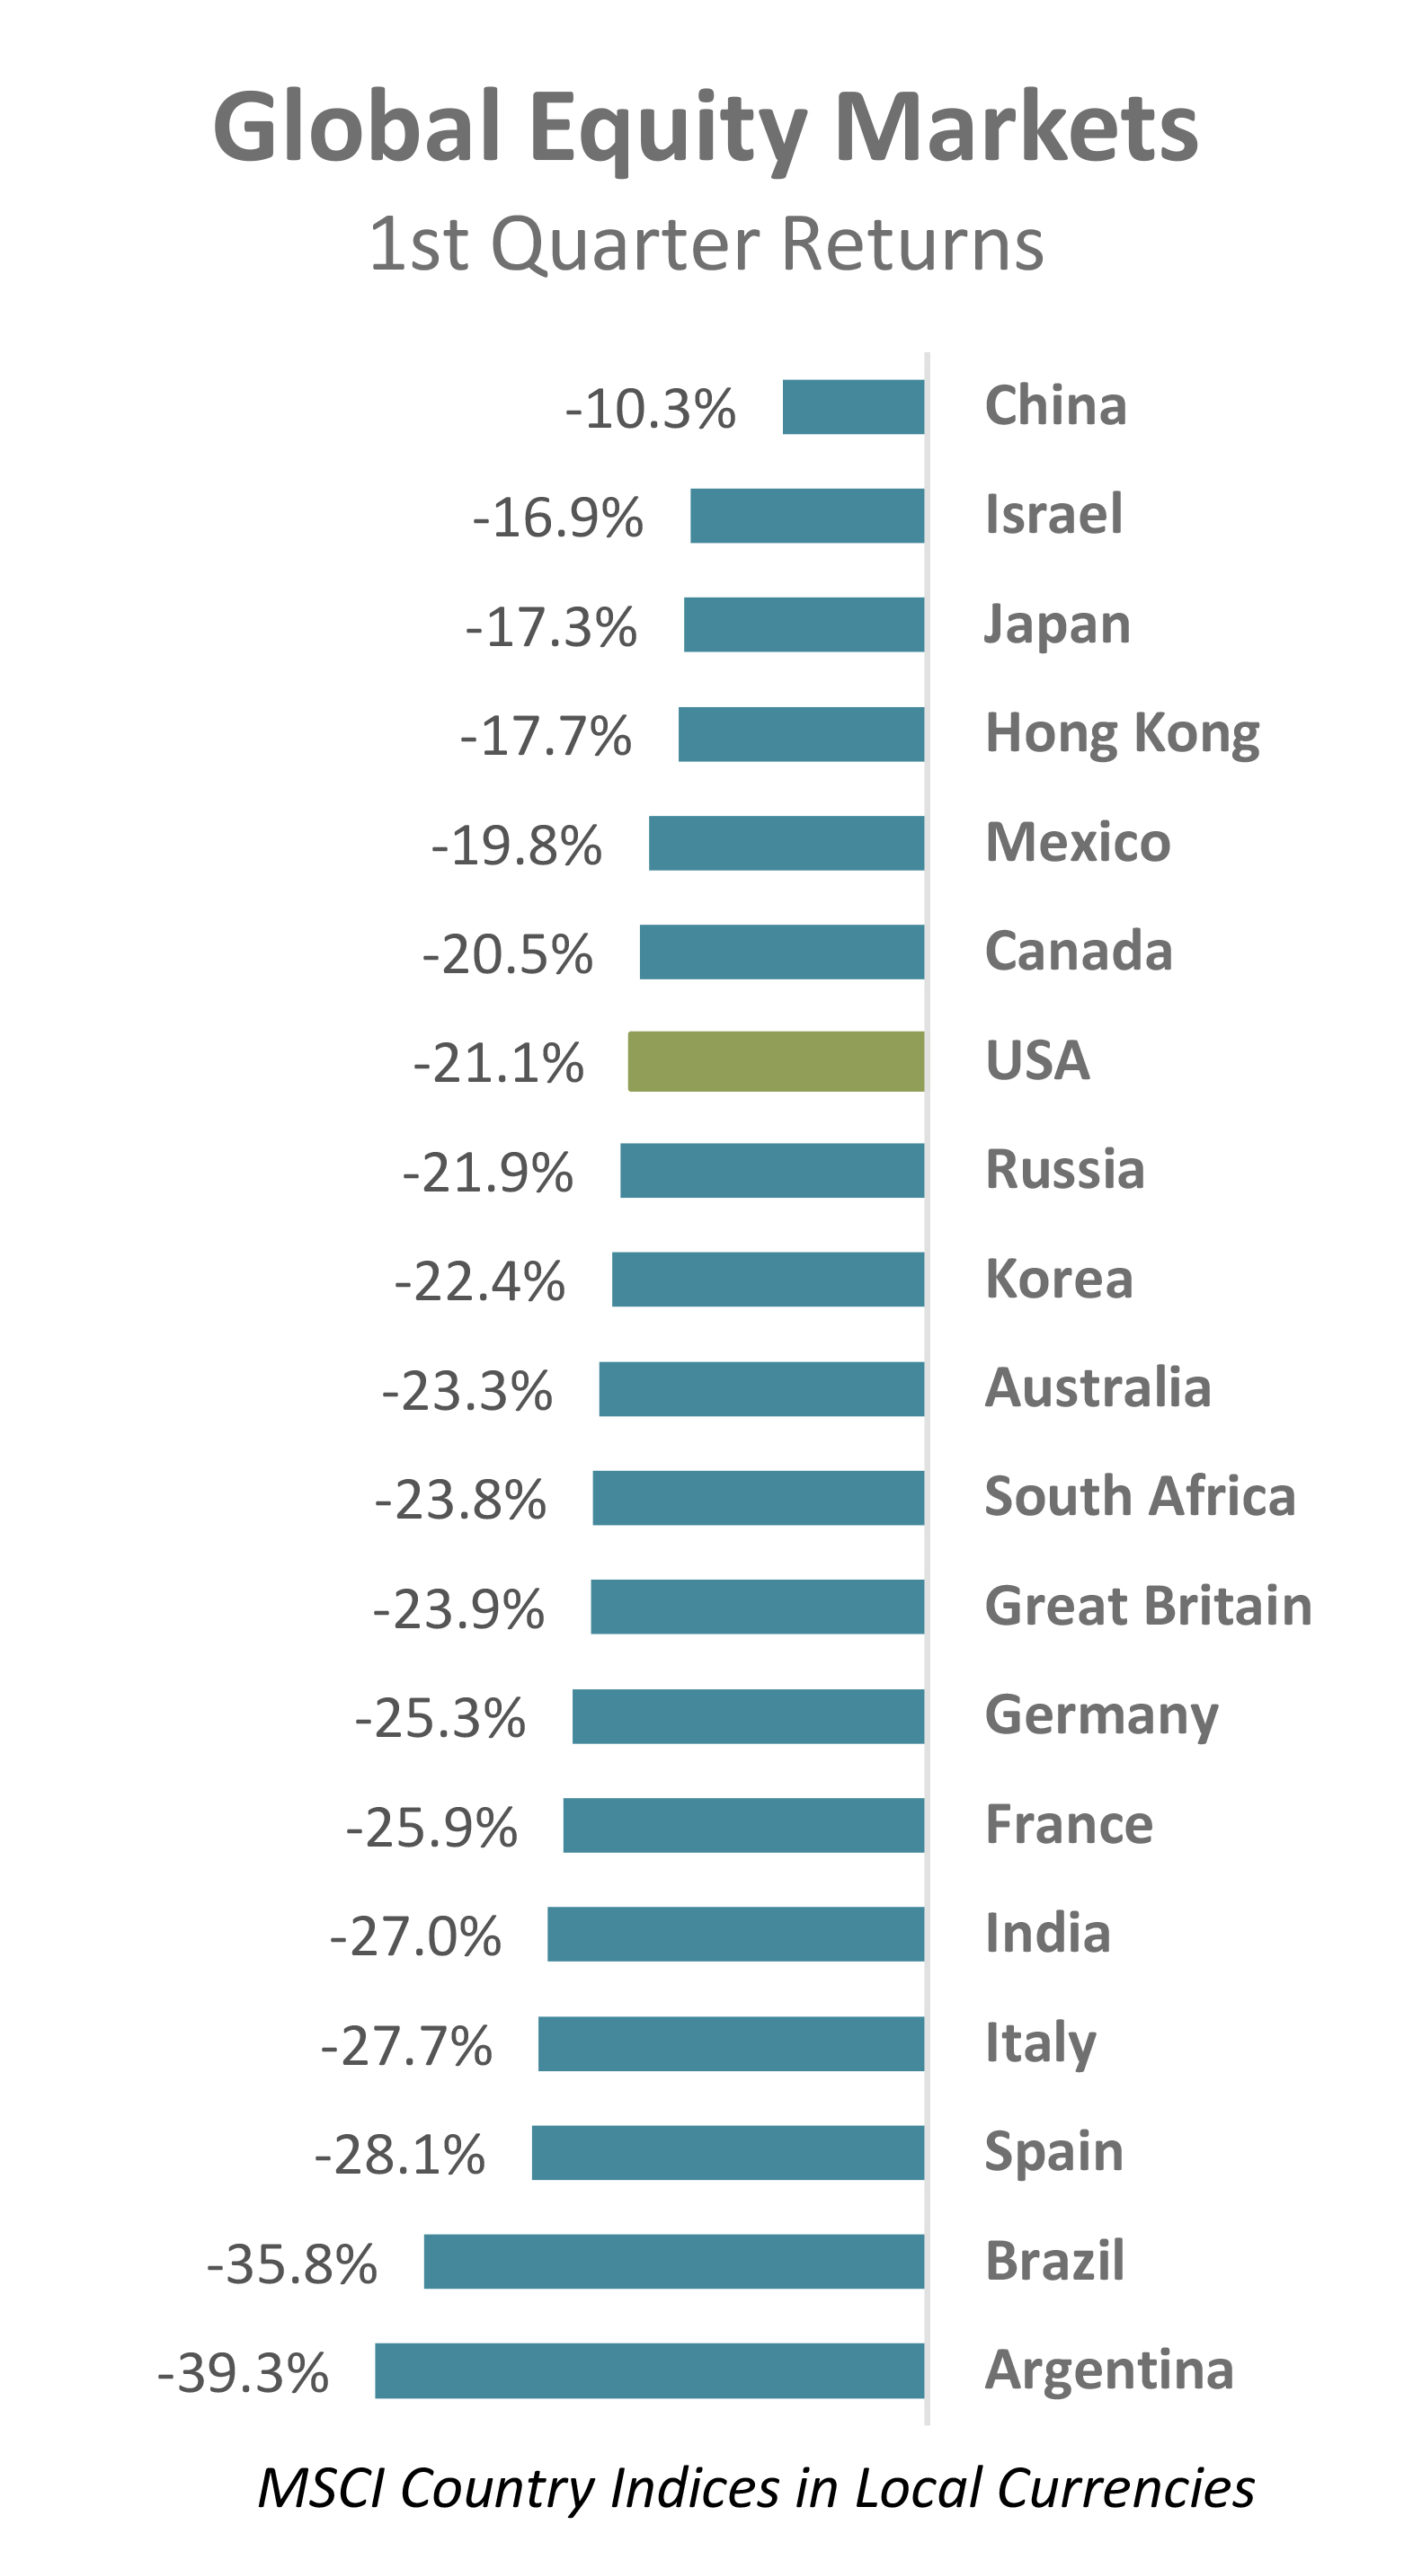
Recap – Despite a number of markets across the globe setting new, all-time highs intra-quarter, major markets were universally weak for the full period.
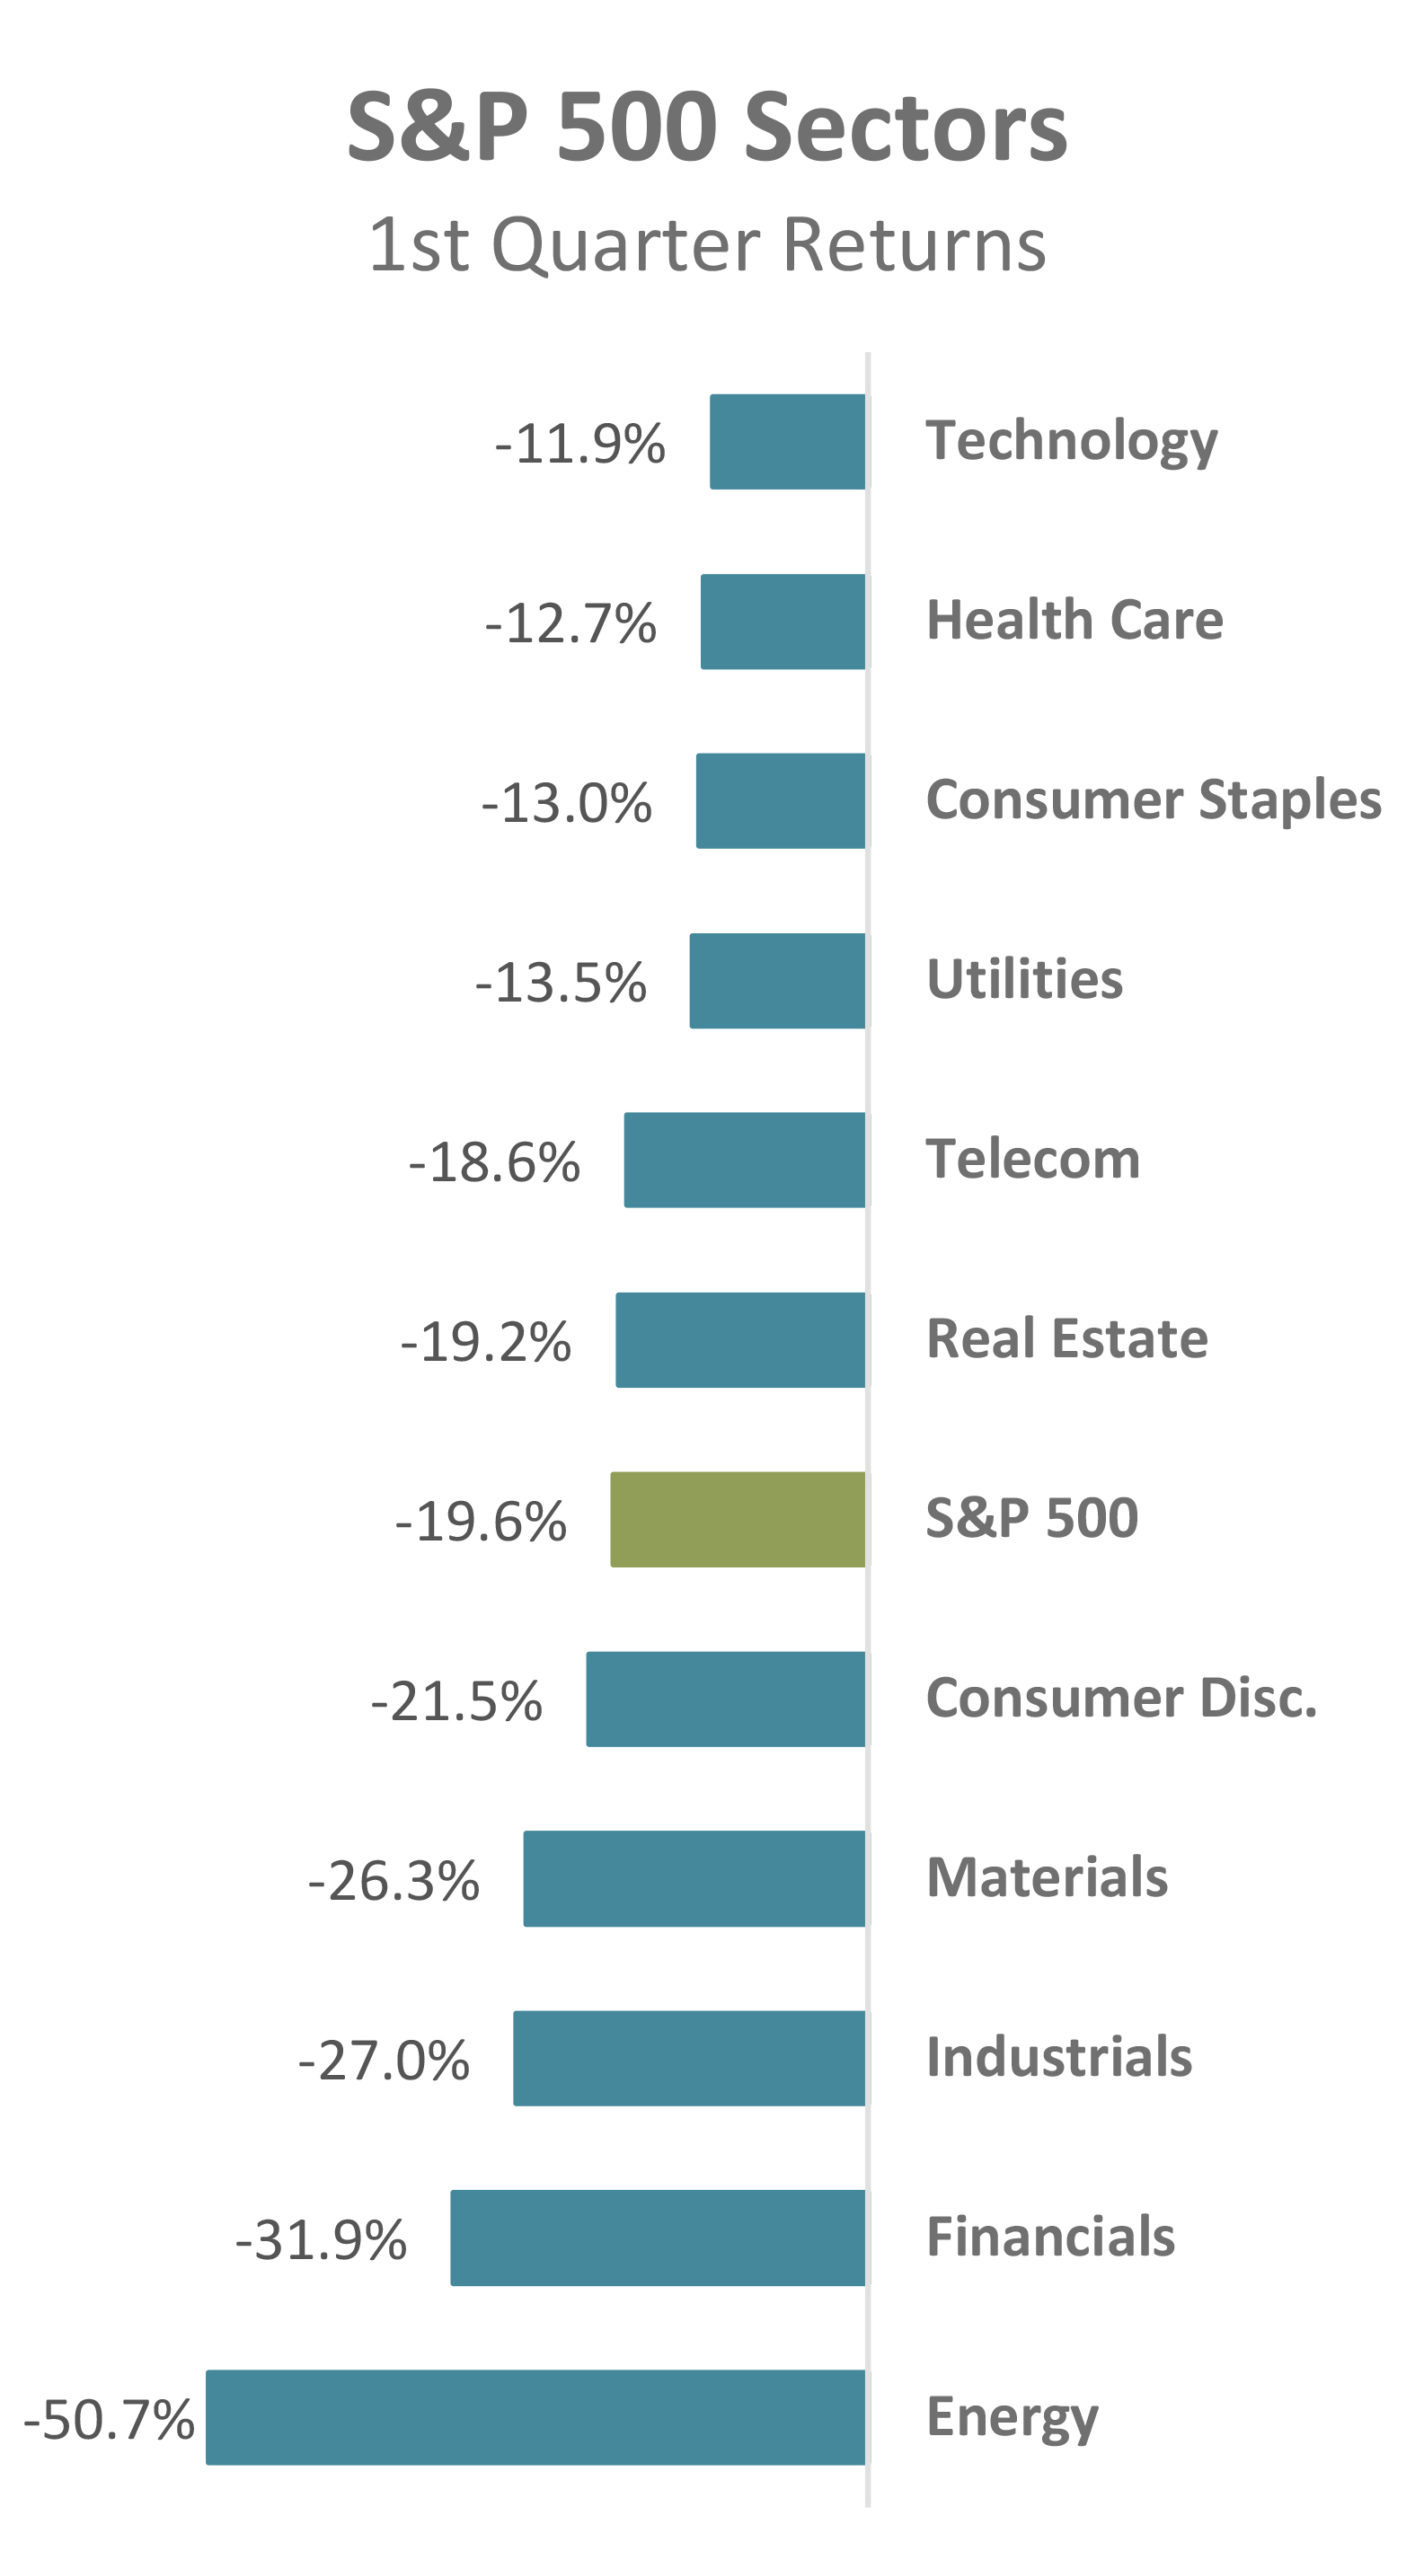
In addition to differences in geographic returns, there were notable differentials in returns due to style and economic sector. Most notably, growth outperformed value, primarily as a result of the difference in sector make-up between the two styles. Growth indices tend to include more Technology and Health Care stocks, two sectors that held up better than the overall market. Value indices, on the other hand, tend to be made up of stocks from more cyclical sectors such as Industrials, Materials, Financials, and Energy, all of which were underperformers for the quarter. Energy was a particularly weak performer due to weakness that stemmed not just from weaker energy demand due to the coronavirus, but also increased supply resulting from an ongoing dispute between Russia and Saudi Arabia.
Outlook – As valuation-oriented investors, we will generally view lower overall stock prices to mean that equities are cheaper and hence more attractive. While we still believe that to be the case, we acknowledge that at least a portion of the recent market weakness is the result of economic activity that will forever be lost. It is therefore incumbent upon us to judge the magnitude of the price weakness relative to lost revenues and earnings.
We have written about this before, but traditional valuation metrics or approaches are often ill suited to periods of unusual economic activity. As an example, Wall Street typically judges the attractiveness of stocks based on a Priced to Earnings (P/E) multiple that relies on a forward earnings projection that spans only the next 12 months. Given that many companies are likely to see severely depressed earnings in the near term, this metric is unlikely to provide any real insight as to the long-term value of a stock or markets. This may seem like common sense, but we’ve already seen and heard firms on various media outlets talk about how stocks will only get more expensive in the coming months because earnings estimates for the next year may fall by a greater percentage than their stock prices.
In deciding how much to allocate to risk assets or stocks, we prefer to use normalized earnings. Normalized earnings work to smooth out some of the cyclicality and non-recurring items that can materially impact short-term earnings figures. In our opinion it gives a more consistent, and hence better, gauge of a company’s or the markets’ true long-term earnings power. It is a methodology that will be particularly useful as we navigate the coming quarters.
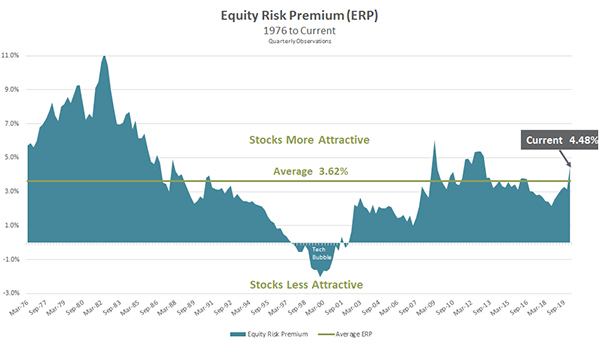
Given our comments on using normalized figures in valuation analysis we wanted to revisit a graph (below) that we’ve shared previously in CFO Reports. It shows the Equity Risk Premium (ERP) for the S&P 500 relative to the real yield of a 10-Year U.S. Treasury bond. The calculation uses normalized earnings for the S&P 500 and attempts to judge the relative attractiveness of the S&P 500 to a risk-free U.S. Treasury. Since investing in stocks is perceived to be higher risk than investing in a U.S. Treasury bond, investors are able to demand a “risk premium”. Our graph shows that has historically been around 3.62%. As a result of the recent selloff, that figure today is now much higher at 4.48%. Stocks clearly come with increased price volatility, but at current valuations, we believe the added return adequately compensates investors for the greater risk.
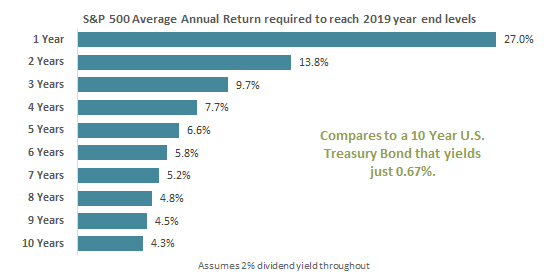
Another far simpler way to think about the stocks versus bonds choice is to think about their respective starting points. A 10-Year U.S. Treasury bond yielded just 0.67% at quarter end. We can assume that to also be the annualized return for the bond over the next 10 years and compare that to how long investors think it may be before markets return to where they were at the end of 2019. As the following chart shows, even if we assume it takes 10 years for markets to return to their 2019 end of year levels the return is multiples of that of the Treasury bond (4.3% versus 0.67%). We can’t know how long it will take for markets or the economy to recover or what that recovery might look like, but for investors able to withstand the current volatility, equities appear to be a good relative opportunity.
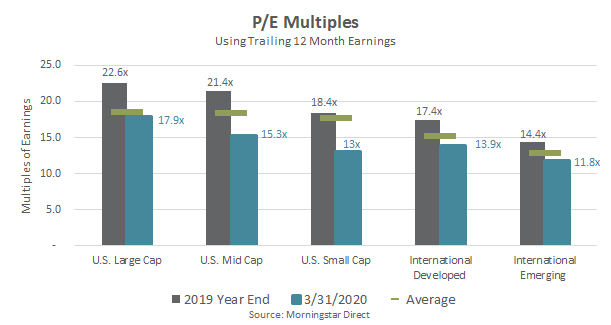
Obviously, the above analysis focuses specifically on the U.S. large cap stock market and U.S. Treasuries. We look at a number of other market segments, as well, but the story and outlook are similar. In the following chart we show the difference in current valuations (blue bar) compared to where they were at the end of 2019 (grey bar) and the average (horizontal green line) over more than a 20-year period. In this analysis we are showing a Price to Earnings multiple that uses the trailing 12-month earnings (i.e. not impacted yet by the global pandemic slowdown). Regardless of geography or size of company, stocks broadly went from trading at premiums to historical averages to reasonable discounts.
Bonds
Recap – Bond returns exhibited far more dispersion than that witnessed in equity markets. The Bloomberg Barcap Aggregate U.S. Bond Index returned a +3.1% for the quarter, but the result doesn’t indicate just how various parts of the underlying bond market performed. As fears due to the coronavirus intensified, investors moved out of risk assets and into cash and U.S. Treasuries. Bonds with any real or perceived credit risk saw widespread selling, resulting in negative returns for virtually all non-Treasury related segments of the bond market.
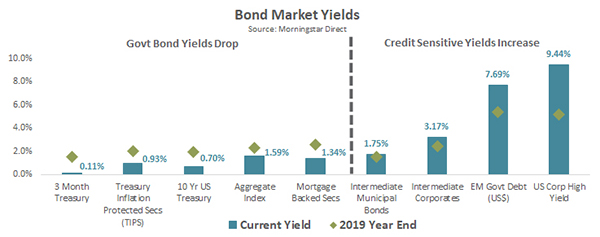
Outlook – The tale of two different bond markets continues in our outlook. Yields for U.S. Treasuries and other government bonds moved lower during the quarter making them less attractive. Yields for more credit sensitive bonds (corporates, asset backed, bank loans, high yield, emerging markets, and even municipal bonds) moved markedly higher and became more attractive. Those yields and their accompanying credit spreads (the additional yield one expects to earn as compensation for accepting a higher level of risk) have not reached the extreme levels seen during the financial crisis, but they have reached levels that we find attractive. The degree to which these yields have changed in the last few months is shown in the accompanying chart. The blue bar shows the yield as of the recent quarter end and the green diamond shows where those yields were at the start of the year.
After cutting our exposure to more credit sensitive bonds in January, we plan to revisit this allocation and our positions in light of their now more attractive yields. Overall, despite the drop in yields for cash and Treasury bonds, we believe the outlook for investors has improved at the margin for investors willing and able to invest in the more credit sensitive segments of the bond market.
Real Assets
Recap – As they often do during periods of market stress, real assets, in particular commodities, saw incredible volatility during the quarter. Oil markets were hit hard due to the combined impact of the drop in demand related to the coronavirus as well as the related oil price war between Saudi Arabia and Russia. Weakness extended beyond the commodities themselves though, as the stocks of energy and real estate companies were also affected. Precious metals and even gold, a traditional safe haven investment, saw significant market volatility. Gold did manage to end the quarter higher, but not before falling more than 11% in mid-March during the worst of the selloff.
Outlook – At Smith and Howard Wealth Management, we don’t typically invest directly in commodities. Commodities themselves do not pay interest or produce a cash flow, making them difficult to value or invest in directly. We will, however, invest in commodity related businesses that show an ability to add value or create and sustain cash flows and earnings. Many commodity businesses will be significantly impacted by the drop in prices, but we don’t believe all are impacted to the same degree; this should ultimately create opportunities within the space. Businesses with stronger balance sheets, business models less reliant on commodity prices, and essential infrastructure assets will eventually be recognized and appreciated by investors. Despite the weak performance over the last quarter we continue to believe that energy pipelines (often referred to as MLPs) is one such area that will reward investors who are able to focus on the long term. Despite volatile securities prices, these businesses’ cash flows have proved resilient through prior periods of market stress.
Outlook Summary
We have stressed for the last few years that the investing environment presented challenges for investors and their advisors. That continues to be true, yet the nature of the challenge has shifted. Prior to the past month, the primary challenge for investors was the expensive valuations of both stocks and bonds at the same time. The recent selloff in broad equity markets, commodities, and all but U.S. Treasuries within bonds has resulted in more compelling valuations and future return expectations. The selloff, as always happens, has been accompanied by increased volatility and fear that makes taking advantage of those opportunities a different type of challenge.
It would never be our intention to skim over the human cost or element of what is occurring, but as a financial advisor it is our job to help our clients navigate difficult times. As painful as such periods may be, they create opportunities that we believe investors should aim to capitalize upon.
Contact Brad Swinsburg 404-874-6244 to discuss our market outlook or any other investment concerns or questions you have.
Explore more information on the first quarter of 2020 by visiting these links:
On the Horizon: First Quarter 2020
Unless stated otherwise, any estimates or projections (including performance and risk) given in this presentation are intended to be forward-looking statements. Such estimates are subject to actual known and unknown risks, uncertainties, and other factors that could cause actual results to differ materially from those projected. The securities described within this presentation do not represent all of the securities purchased, sold or recommended for client accounts. The reader should not assume that an investment in such securities was or will be profitable. Past performance does not indicate future results.

Subscribe to our newsletter to get inside access to timely news, trends and insights from Smith and Howard Wealth Management.
 Back to Insights