ARTICLE
Market Outlook – Improved Valuations Increase Expectations For Long-Term Returns | Fourth Quarter 2018
by: Smith and Howard Wealth Management
In a nutshell: Despite reasonably strong earnings, weakness in global equities drove an improvement in valuations and hence our long-term equity market outlook. U.S. equities remain relatively expensive when compared to international equities, both developed and emerging. This, despite reasonable valuations and an improved outlook. While we still do not believe equities to be “cheap,” an improved valuation picture does increase our expectations for their long-term returns, especially relative to bonds.
For an in-depth look at the big picture, read below.
The Big Picture
It is no secret that we strive to execute on the simple but difficult to execute philosophy of “buy low, sell high.” We stick to this philosophy for a good reason: shifting portfolios towards inexpensive assets and away from expensive ones “wins” over the long term. So, while it is interesting to speculate and debate about near-term events and breaking news, ultimately, investment returns are driven by valuations.
Equity Outlook Improves: P/E Ratios and International Equities
Often, we have used complex charts and graphs to explain our outlook. Given the overriding effect of the equities market this quarter, the illustration is much more straightforward and is probably best illustrated by looking at the Price to Earnings (P/E) ratio for the S&P 500. The P/E ratio is the most common valuation metric used in judging the attractiveness of the equity market. All else being equal, an investor should prefer a low P/E to a high P/E. Rarely is “all else equal”, but conceptually an investor would prefer to pay a lower per share price for every dollar of earnings a company generates.
As the following graph shows, that multiple of earnings dropped rather significantly over the last quarter. The blue line shows what the P/E ratio has been across time and the straight green line is the average for the period shown. That ratio has exceeded the average for the last few years and was the reason many investors (including us) believed that the market was expensive. With market prices falling this past quarter, that ratio has now dropped and is slightly below the average.
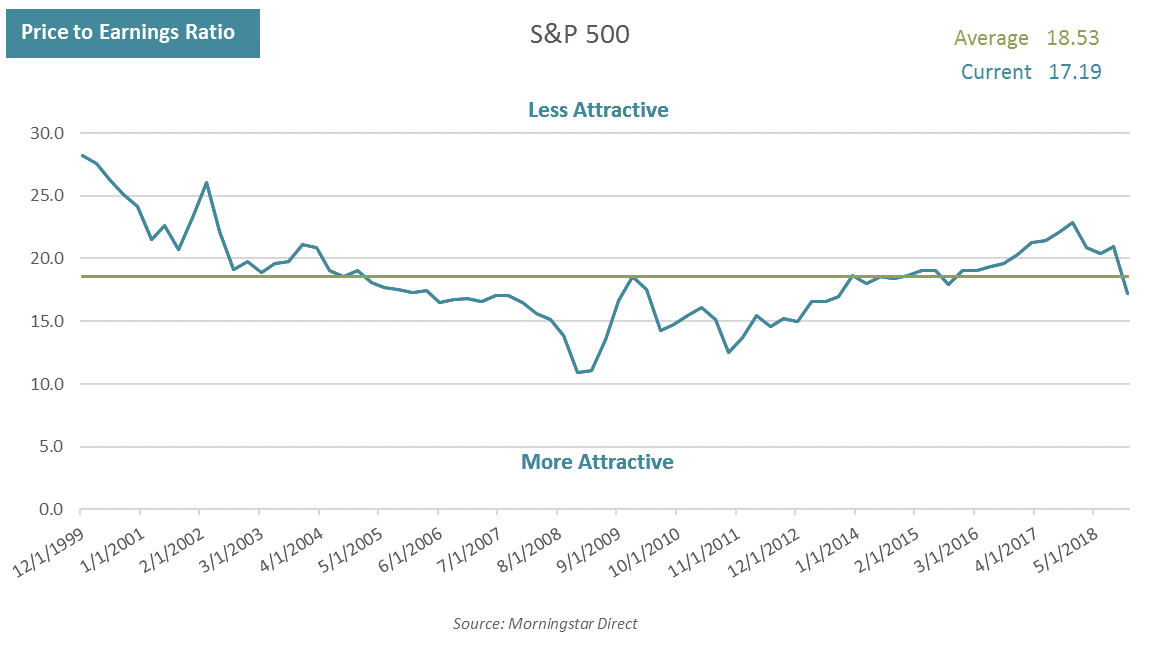
The outlook for equities, therefore, has improved and is now more positive than it was just a few months ago. We do look at other valuation metrics and they paint a similar picture. All now show the market at more reasonable valuations. We do not, however, believe that markets are overly “cheap”. They are certainly cheaper than they’ve been for some time and we believe investors should be rebalancing to their equity target. Markets often swing from one extreme to the other and we’ve gone from expensive to fair, but not cheap. Should equities fall further and become truly cheap we will look to take advantage of that weakness by increasing our equity targets.
The discussion and outlook to this point has centered specifically on U.S. equities. SHWM runs a globally diversified program, however, so we look beyond our own borders to gauge the attractiveness of other markets. Today, we believe both international developed and emerging market equities offer a compelling opportunity. We believe investing in international equities today extends beyond the basic diversification benefits that might typically be the rationale for investing abroad. Valuations in international developed and emerging markets are more attractive than those found in the U.S.
As we’ve discussed previously, our philosophy, outlook, and allocations are driven by valuations. Our valuation work and the below graph compares the relative attractiveness of various major equity markets across the globe.
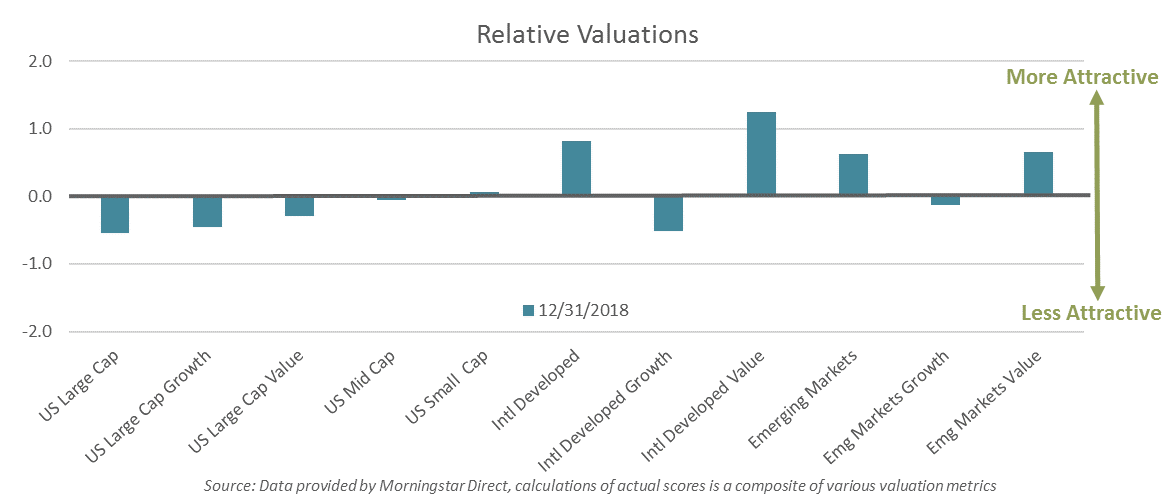
A score of 0 simply indicates that the asset class or category is at a normal valuation level relative to the broader global equity market. Scores greater than 0 indicate a more compelling valuation and scores below 0 a less compelling valuation. The further away from 0, the greater the relative opportunity. Scores in excess of +/- 1 would typically be considered meaningful enough to warrant shifts in portfolios. As the graph shows, U.S. markets, specifically U.S. Large Cap, are on the more expensive side of 0, while International Developed, Developed Value and Emerging, are mostly above 0. While still meaningful, the gap between U.S. and International markets did close a bit during the last quarter due to the underperformance of the U.S. market.
It may seem somewhat obvious that cheaper stock prices should increase their attractiveness, but that simple, rational logic is often lost during difficult markets when short term fears can overwhelm our senses and drive irrational decisions. Our focus on valuations and quantitative measures is intentionally designed to help us avoid the typical behavioral traps that befall most investors.
To further discuss our outlook on the market, contact Brad Swinsburg 404-874-6244.
Explore more information on the fourth quarter of 2018 by visiting these links:
Market Recap: Fourth Quarter 2018
On the Horizon: Fourth Quarter 2018
A Deeper Dive: Fourth Quarter 2018
Unless stated otherwise, any estimates or projections (including performance and risk) given in this presentation are intended to be forward-looking statements. Such estimates are subject to actual known and unknown risks, uncertainties, and other factors that could cause actual results to differ materially from those projected. The securities described within this presentation do not represent all of the securities purchased, sold or recommended for client accounts. The reader should not assume that an investment in such securities was or will be profitable. Past performance does not indicate future results.

Subscribe to our newsletter to get inside access to timely news, trends and insights from Smith and Howard Wealth Management.
 Back to Insights