ARTICLE
Politics and The Market – August 2020
by: Smith and Howard Wealth Management
In our recent On the Horizon video, we highlighted and discussed a number of topics that we expected to impact markets over the coming months and quarters. One of those topics was the upcoming election cycle and, in particular, the race for the Presidency. As part of that message, we cautioned investors against overreacting to election-related developments and briefly noted that market reactions to elections are often much less or different than one might expect. As the election cycle heats up, we thought it would be a good time to revisit the topic and provide some historical context and perspective.
Before we go any further, I want to make sure that I make clear that we absolutely understand that this cycle is unique. We continue to deal with the worst global pandemic in over 100 years and it comes at a time when our country is perhaps as polarized as it has ever been. There is no debating that emotions are raw. While we are always reluctant to say, “this time is different,” I think most would agree that “this time feels different.”
We are not going to attempt to debate any of that in this article. Nor are we going to tell people how they should be voting or even which candidate would be better for the market or their investments. Our goal, rather, is to help provide some perspective on past election cycles and touch on some things that are likely to be true or supportive of markets, no matter which party or candidate prevails. With that long disclaimer, let’s jump into it.
Political feelings should not impact investment decisions
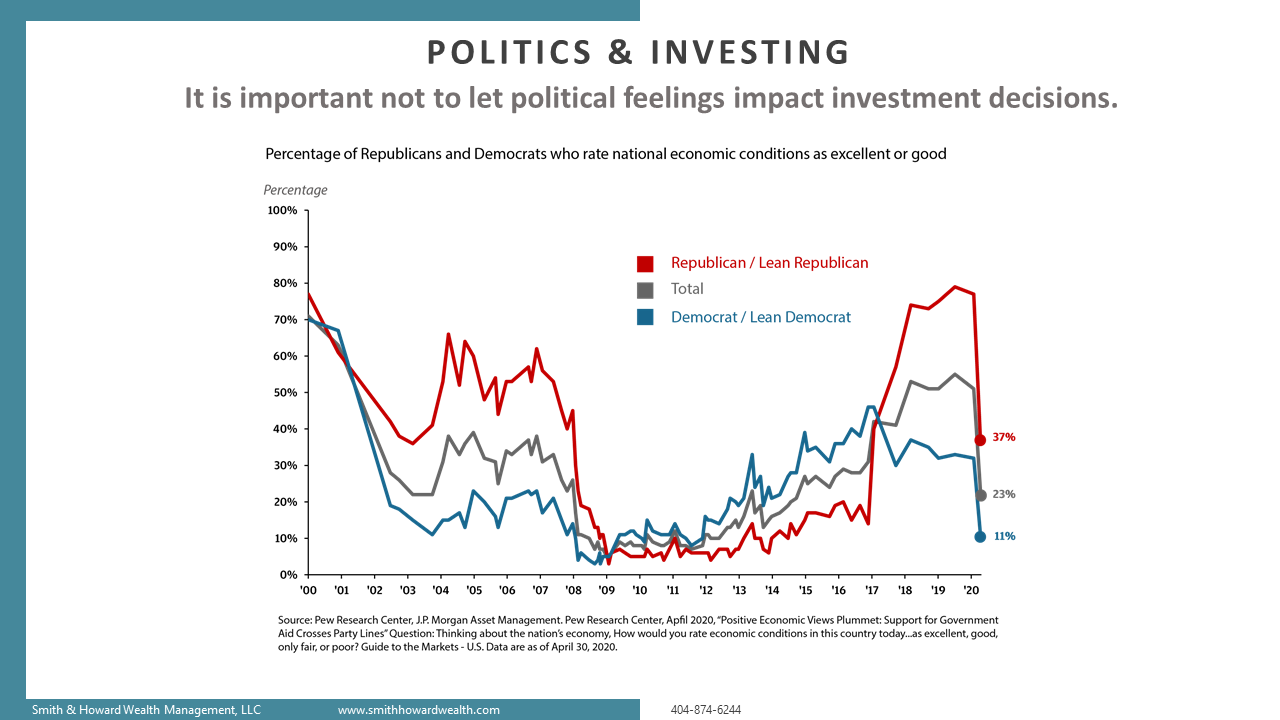
We have used the above chart on politics and investing to talk about why we are so adamant about having a well-defined, numbers-oriented investment process. The chart and data do a great job of showing just how much the typical investor lets their political views impact their economic and investment views.
The blue line shows over time, starting in the year 2000, the percentage of those that are or lean Democrat who believed that economic conditions in the U.S. were good to excellent. By itself, this pattern doesn’t tell us all that much, although one could argue that those Democrat-leaning voters tend to hold a fairly pessimistic view of the economy. Their optimism did climb steadily post the financial crisis and that was, of course, the years in which Democrat Barack Obama held the presidency. Even then, however, it remained below 50%, which is consistent over the last 20 years, except for during the tech bubble on the far left side of the chart.
The red line shows those that are or lean Republican. Now we can really start to see a stark contrast. While Democrats appeared to maintain a fairly consistent, pessimistic outlook, Republicans bounced from rather extreme levels of optimism, during the presidencies of George W. Bush and Donald Trump, to extreme pessimism during the Obama years.
Given that we are talking about citizens of the same country, experiencing the same economy, it is actually pretty amazing to see how two subsets of the same population can see things so differently. The average, shown here as the gray line, obviously falls between the two.
In hindsight, we know that the economy and the market were strong under both parties, and anyone who let their political leanings drive their investment decisions would have been disappointed for fairly long stretches of time.
Stock performance regardless of Presidential party
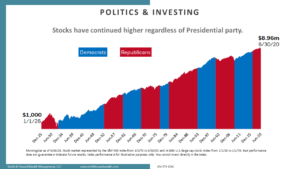
The chart representation above takes an even longer look back at the market and who held the presidency. The chart is quite self-explanatory – the market has risen under both political parties. One point to note is that while we can probably all agree this election “feels” different, there were plenty of other contentious periods covered by this chart, including the Great Depression, World War II and the Civil Rights movement.
Returns during election years
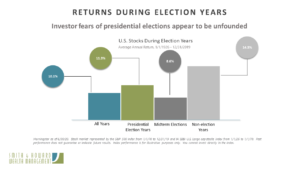
The chart above, “Investor Fears”, focuses on returns during election years. There are plenty of rules of thumb or beliefs that investors have about the market and elections, and not all of them are rooted in fact or backed up by past results.
From 1926 through 2019, the average annual return for U.S. Large cap stocks has been a shade over 10% (left side of the chart). Non-election years (far right side) have resulted in the highest years of returns, but returns during years of a presidential election (shown in green) have also been above average. It is actually mid-term election years that investors should be more wary of. Even then, those mid-term election years still saw a pretty impressive 8.6% gain.
New versus incumbent presidents
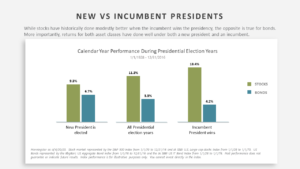
Let’s next look at the chart above on new versus incumbent presidents. This chart shows a comparison of returns for the year in which a new president is elected (the grouping on the left) versus all presidential election years (the middle grouping) and when the incumbent wins (the grouping on the right). Stocks do indeed tend to do better, on average, when the incumbent wins. The opposite is true, however, for bonds. The big picture though, as with the prior chart, is that all the returns are positive and meaningfully so. One scenario may be better than the other historically, but investors have been rewarded under both scenarios.
Seasonality
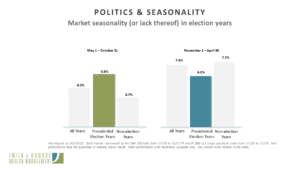
There is also often a lot of discussion about seasonality around the election. In the above comparison, the chart on the left looks at the returns during the six-month period from May through October – what would, during election years, be the six months prior to the election. The chart on the right shows returns for the six months from November through April or the six months after the November election period. This chart is a bit surprising as it does show some seasonality. However, that seasonality shows up not in election years, but in non-election years. Election years, on average, show no discernable seasonality.
One quick addition that is not depicted in this chart is that there is an elevated level of volatility around the election itself. The months and weeks leading up to an election typically see more market volatility and have some indicative power in predicting the eventual winner. A lot of investors tend to want to wait until after the election to see what happens, but the reality is that if you are going to bet on a particular election result – which we obviously advise against – it is best to do that well in advance of the election itself.
Divided versus same-party government
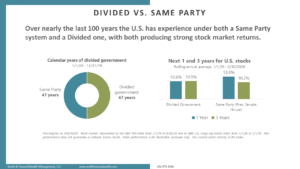
Of particular interest in this cycle is the idea that one party may again control the House, the Senate and the Presidency. The old market adage says that markets prefer a divided government because of the stalemate effect it often has. A same-party government is assumed to be able to make more substantive changes. This creates greater uncertainty, which in turn is bad for stock prices and risk assets.
Again, the numbers don’t actually bear that out. In the chart (“Divided vs. Same Party”) above, the left shows that over the last 94 years, we have spent an equal amount of time under both a same-party government and a divided government. The chart on the right depicts a one-year (blue bars) and three-year (green bars) average return for a divided government system and a same-party system. Stock markets, on average, do nearly 3% better in the calendar year following an election in which the same party takes control of all three houses. On a three-year basis it does switch, but the difference is really not significant or meaningful.
Again, much like the prior comparison of seasonality in politics, these results run counter to what many of us have been told over the years or might naturally expect.
Support for asset prices
As stated at the outset, the purpose of this discussion is not to influence anyone’s political beliefs or votes. The intent is to dispel some common election-related beliefs and remind folks why we try not to let politics drive our investment decisions.
We understand how hard that is, especially this year. It is easy to get wrapped up in the what if and disaster scenarios. There are always going to be extreme views and they may occasionally even happen to be right, but more often than not, the truth is somewhere in the middle.
With that in mind, we would like to end with some positive investment-related thoughts about things we believe will be true no matter who the winner of the election is.
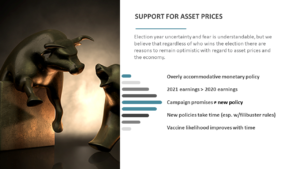
First, regardless of the election, the Federal Reserve has made it abundantly clear that interest rates are going to stay extremely low for the foreseeable future. That should be supportive of risk-oriented asset prices (i.e. stocks). When cash and high quality bonds yield next to nothing, as they do today, investors will migrate to investments that have the potential for real returns – even if they come with volatility. Low interest rates also mean that our ballooning federal debt levels remain manageable and therefore not a cause for concern – at least not in the near term.
Second, investors are always hyper-focused on earnings figures compared to prior periods. With the extreme drop in Q2 earnings during 2020, there is a high probability that earnings for 2021 will be higher year over year. They may still be depressed from 2019 levels for many companies, but progress relative to 2020 would still be viewed as good news as it supports the idea of a continuing recovery.
Third, let’s not forget that campaign promises and rhetoric can be difficult to turn into policy. A lot is said during election cycles, many times with the best of intent, but follow through is not possible for a variety of reasons.
Fourth, and related to our prior point, new policies and legislation take time. Even a party that controls all three houses, as we saw during the last cycle, will take time to craft policy and navigate the system.
Lastly, and perhaps most importantly, the more time that passes, the closer we all are hopefully to a vaccine for the novel coronavirus. An effective vaccine would solve a lot of economic woes and investor worries. As important as the election is, a vaccine and a return to more normalcy is far more important to global markets and economies.
We hope everyone has found this article interesting and helpful. Please let us know if you have any questions or would like to schedule a call to discuss this article in more detail. We continue to welcome any feedback you may have on our efforts to communicate our thoughts during these unprecedented times. We hope you all stay healthy and safe.
The video on which this article was based can be found here.
Unless stated otherwise, any estimates or projections (including performance and risk) given in this presentation are intended to be forward-looking statements. Such estimates are subject to actual known and unknown risks, uncertainties, and other factors that could cause actual results to differ materially from those projected. The securities described within this presentation do not represent all of the securities purchased, sold or recommended for client accounts. The reader should not assume that an investment in such securities was or will be profitable. Past performance does not indicate future results.

Subscribe to our newsletter to get inside access to timely news, trends and insights from Smith and Howard Wealth Management.
 Back to Insights