ARTICLE
An In-Depth Look at the Markets through the 2nd Quarter
by: Smith and Howard Wealth Management
Markets bottomed in late March and, despite a few, short setbacks, spent most of the next three months recovering much of their early year losses. The beginning stages of the recovery could largely be attributed to governments around the globe announcing massive fiscal and monetary stimulus measures meant to keep their economies and citizens afloat while they attempted to slow the spread of the COVID-19 virus. Those government actions appeared to provide a backstop for markets and gave investors enough confidence to start adding risk back to their portfolios. As the 2nd quarter progressed, the rally gained further steam as economies began to slowly reopen and there appeared to be positive progress on the fight against the virus – availability of medical equipment, treatments and even vaccine trials.
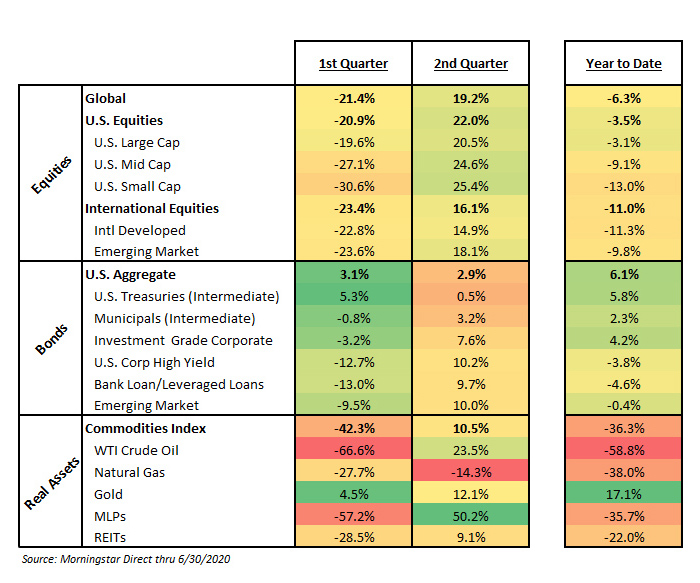
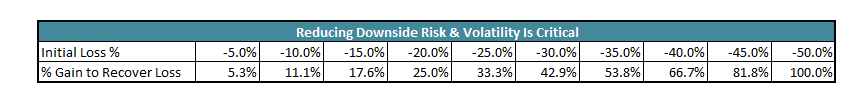
As our markets “heat map” shows, returns were strong across major stock, bond and real asset markets, with the lone exception of natural gas. In many cases the percentage gained appears to equal or even exceed the percentage lost during the 1st quarter. Year-to-date figures, however, remain negative for many of those markets (mostly within equities) due to the sequence of those returns. For example, investors often forget that a loss of 20% requires a subsequent gain of 25% just to get back to flat or break even. In fact, as the following table shows, the percentage necessary to recover a loss increases at an exponentially faster rate the larger the initial loss percentage.
Equities
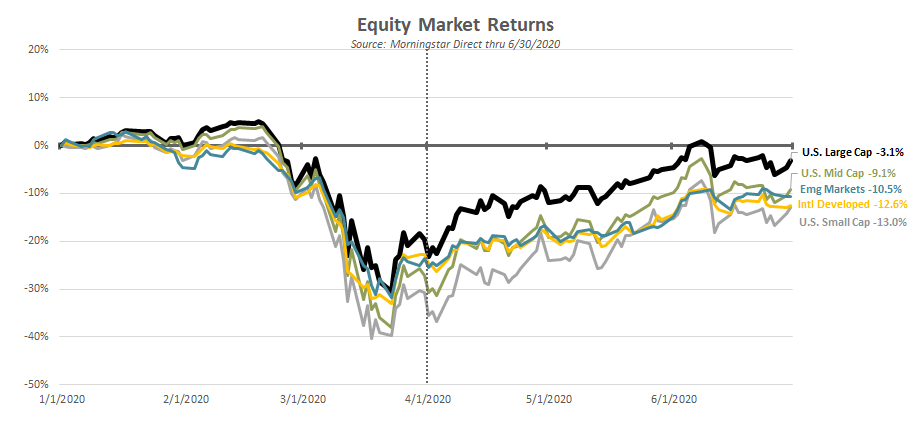
Recap: Equities continued their impressive rally throughout the 2nd quarter, but most markets remained lower on the year.
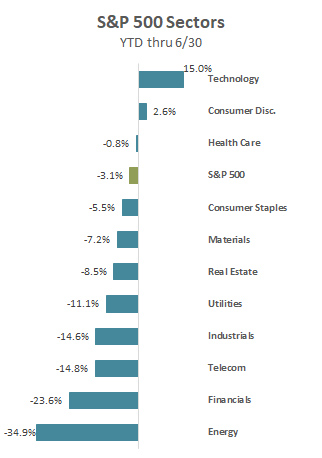
While most major market segments remained negative on the year, there were a few notable areas that crossed back over into positive territory during the quarter. Most notably, U.S. Large Cap Growth stocks (+9.8%) led by gains in Technology and Consumer Discretionary stocks. Technology companies were viewed as relatively better positioned to hold up during the shutdown – and perhaps even benefit from it. Consumer Discretionary stocks might initially be a bit of a surprise, but Amazon now makes up nearly 25% of the sector index and the combination of Home Depot and Lowe’s another 17%. I can only speak for my own household, but I know there has been a dramatic increase in our online shopping and home improvement projects!
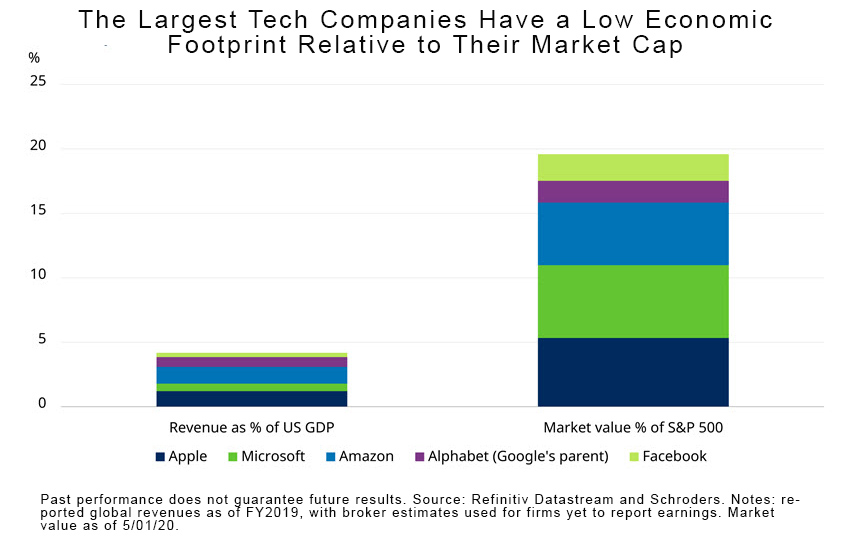
Perhaps the most frequently asked question among investors (including us) right now is related to understanding what appears to be a large disconnect between Wall Street and Main Street or the overall economy. How is it possible that stock markets have recovered most of their losses, yet the economy remains well below its normal capacity and significant uncertainty remains? As confusing as it appears, there are a number of reasonable explanations.
As the below graphs show, the market is not the economy. Apple, Microsoft, Amazon, Alphabet (Google’s parent) and Facebook account for nearly 20% of the S&P 500 market capitalization, yet their revenues as a percentage of US GDP are less than 5%.
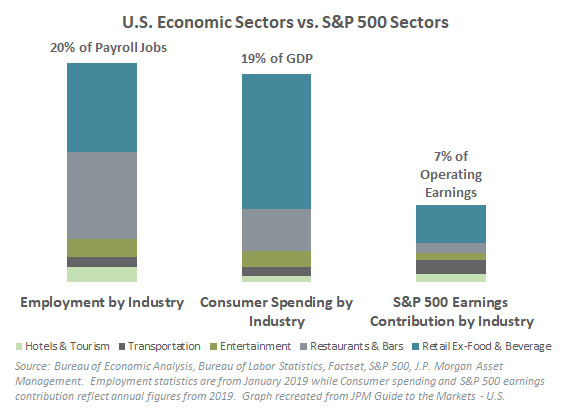
Looking at the same dynamic from a sector standpoint, we see again that the market doesn’t necessarily measure the same things or reflect the broader economy. The most affected economic sectors (Hotels and Tourism, Transportation, Entertainment, Restaurants and Bars and Retail Ex-Food and Beverage) make up a far greater proportion of overall employment and the economy than they do of the market or S&P 500. Those sectors account for only 7% of the operating earnings of the S&P 500. This isn’t a new dynamic, but it has certainly become more noticeable during the current economic situation.
Stocks are very long-term investments. This may sound obvious and even simplistic, but in traditional finance terms stocks are theoretically valued as the sum of the present value of all their future earnings. To the extent that the current downturn is short-lived, earnings return to their prior level and the growth trajectory of those earnings resumes, the impact of any one year on a stream of earnings that may extend out decades shouldn’t have a tremendous impact.
Lower cash and U.S. Treasury yields lead stocks to trade at higher multiples of earnings. Investors don’t make decisions in a vacuum. With cash and even long-term U.S. Treasury yields well below historical rates of inflation, investors are searching for places to put their money that at least give them the potential for returns that exceed inflation. Stocks obviously come with more volatility, but faced with few other viable options, investors have returned to stocks and driven prices back close to pre-COVID 19 levels.
Last, but not least may be the perceived government backstop. As was mentioned at the beginning of this piece, the current market rally started as a result of fiscal and monetary actions taken by governments across the globe. Those actions were successful in the short term, but may create a long-term issue or cost. Investors, rightly or wrongly, may now believe that the downside in risk assets is limited due to the willingness of governments to step in and prevent markets from finding a “natural” bottom. Less real or perceived downside risk in stocks will inevitably increase investor speculation and risk-taking.
Outlook on Equities
What a difference just a few months can make (again). With the massive rally in equity markets across the globe, the return outlook has again shifted. This time, however, the direction is lower as substantially higher prices dilute future potential returns.
A significant upward move in prices and a sharp drop in near-term earnings, however, makes it very difficult to quantify just how much investors need to adjust their expectations. As we’ve written about previously (including last quarter), investors need to be careful when using traditional Wall Street metrics to make judgments about the attractiveness of the equity market during turbulent economic periods. Those metrics typically use price and one other per-share variable (earnings, sales, cash flow, etc.). A stock’s price is easily observable and simply “is what it is.” The other metric, however, whether it be earnings, sales, cash flow or some other variable, becomes more problematic during times of stress. Traditional valuation metrics often use the last four quarters’ actual results or estimates of the next four quarters, both of which in the midst of the current pandemic will reflect something that is unlikely to reflect their true earnings power or value.
It is for that exact reason that our preferred method of analysis uses “normalized” earnings or data. Normalizing is an averaging or smoothing technique that reduces the impact of one bad quarter or short time period. That bad quarter or period is still included in the data, but price becomes the more dominant (and our preferred) driver of changes in the outlook.
Using this normalized data, we constructed the following graphic for U.S. Large Cap Equities. The scale on the left vertical axis and blue line corresponds to the normalized Price to Earnings ratio (also referred to as the CAPE Ratio) over time. The dotted blue line shows the average of that ratio over the same time period. The scale on the right and the green line shows the Equity Risk Premium (ERP), a valuation measure comparing stocks’ relative attractiveness to bonds, over time. As the arrows on the far right indicate, the higher the respective observation on the chart the more expensive (and less attractive) the valuation level.
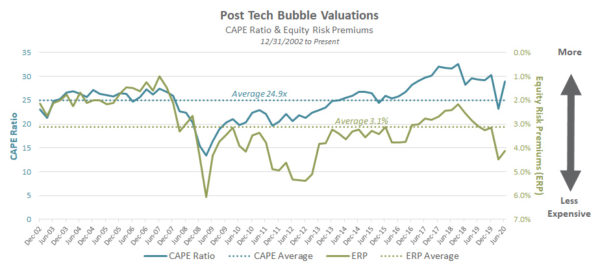
The CAPE Ratio shows a current valuation level that is not just above a longer-term average, but one that is approaching the level it was at before the pandemic related crisis began. The second valuation measure (ERP) takes into account the relative difference between stock and bond valuations and shows a notably different picture. It has not rebounded in the same manner. That is primarily due to historically low bond yields and expectations, rather than stocks being cheap per se.
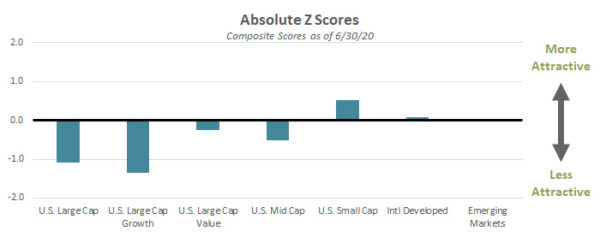
Fortunately, the above measures pertain only to the U.S. Large Cap market. Our valuation work on other segments of the equity market, many of which have not recovered to the same degree on a year-to-date basis, indicates that pockets of opportunity still exist. Value, smaller capitalization and international stocks still trade at valuations that appear more attractive and hence have outlooks comparable to what investors have come to expect from equities.
Bonds
Recap – Similar to the prior quarter, the headline return of the Bloomberg Barcap Aggregate U.S. Bond Index (+2.9%) only tells a small part of the story. The broad index was again positive, but instead of that return being driven only by Treasury bonds and their perceived safety, it was the more credit-sensitive parts of the bond market. Corporate bonds, bank loans, emerging market debt and even municipals saw a significant rally off of the lows seen in late March.
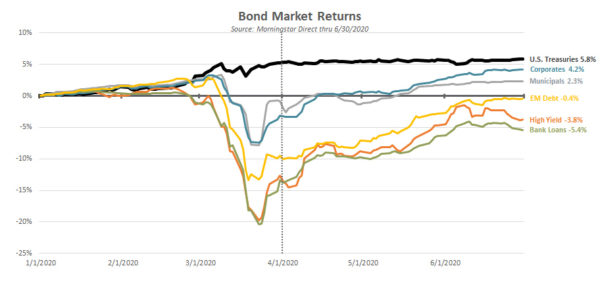
While U.S. corporate high yield, bank loans and emerging market debt have further ground to make up on the year, investment grade corporates and municipals now join U.S. Treasuries with positive year-to-date returns.
Outlook on Bonds
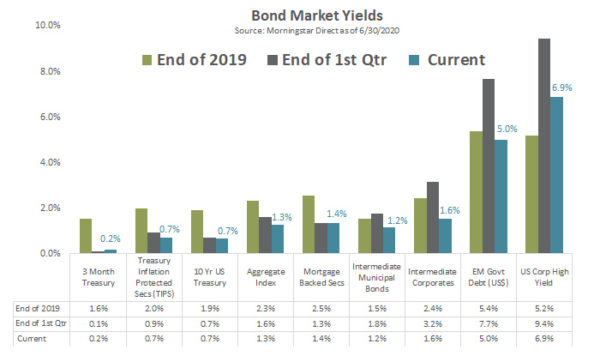
Compared to the issues we outlined in valuing equities during periods of economic stress, the long-term outlook for bonds is typically much more straightforward. Bonds can of course be impacted by credit events (bankruptcies), but at a high level we can still utilize stated yields to maturity to gauge the potential level and attractiveness of future returns. In the graph below, the blue bars represent the current yields to maturity for the indicated segment of the bond market and are shown relative to the prior quarter end (grey bars) and the prior year-end (green bars). In the case of U.S. Treasuries and other high-quality credit segments, yields remain close to the levels from the end of March and well below where they started the year. More credit-sensitive portions, such as emerging market debt and corporate high yield, dropped considerably from the prior quarter end.
After cutting our exposure to more credit-sensitive bonds in January, we used the higher yield levels available in early April to add this exposure back to portfolios. Despite the recovery of those markets during the quarter, we remain constructive on their outlook, especially when compared to the historically low yields in U.S. Treasuries and other highly rated market segments.
Real Assets
Recap – The story in real assets, in particular commodities, resembles that of the broad bond benchmark index in that the headline return figure obscures much of the story.
The broad commodity index, defined as the S&P GSCI, returned +10.5% for the quarter, but saw much larger price swings in several of its underlying components. What transpired in oil, in particular, was almost unimaginable. Oil not only dropped precipitously but traded at a negative dollar value for a short period of time! Oil hit a low of -$37.63 on April 20, 2020 ahead of the May futures contract expiration on April 21. Not wanting to be required to accept physical delivery of barrels of oil due to the contract expiration, traders frantically closed out positions at whatever price they could. Fortunately, that phenomenon was short-lived as the price of oil recovered to nearly $40 per barrel by quarter end.
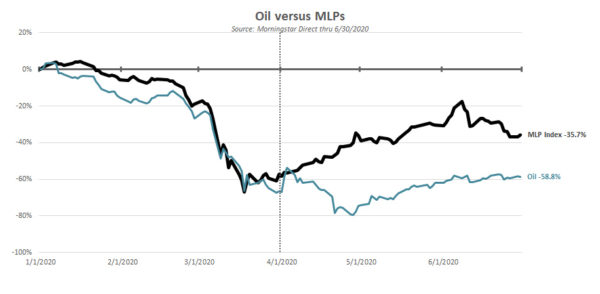
Another notable mover during the quarter was energy pipelines or MLPs. MLPs during times of oil market stress have often traded in sympathy with the commodity. That was again true during the 1st quarter of 2020, but as the following graphic shows, their paths diverged rather markedly the last few months, with the recovery in pipelines far outpacing that of oil or natural gas. We have long argued that the cash flows of energy pipelines are not as tied to the price of oil as their stock prices would indicate. We’ve also argued that, if anything, they should trade closer with natural gas prices since the majority of pipeline capacity is used for transporting natural gas, not oil.
Outlook on Real Assets
At Smith and Howard Wealth Management, we don’t typically invest directly in commodities. Commodities themselves do not pay interest or produce a cash flow, making them difficult to value or invest in directly. We will, however, invest in commodity-related businesses that show an ability to add value or create and sustain cash flows and earnings. As alluded to in our Real Asset recap, we continue to believe energy pipelines are one such business and that current valuations remain attractive despite the significant recovery during the recent quarter. Another business or entity structure that we continue to monitor is real estate or Real Estate Investment Trusts (REITs). REITs may offer some diversification benefits for portfolios, but we don’t believe that at current valuations they warrant a direct or focused allocation. Unlike most energy pipelines, REITs are also included in broader equity indices, which means portfolios already have exposure to the sector in that manner.
Outlook Summary
We have stressed for the last few years that the investing environment presented unique challenges for investors and their advisors. That has certainly not changed over the last few months, but the nature of the challenge continues to shift. At the outset of 2020, expensive valuations in both stocks and bonds created a dilemma for investors and advisors. Investors could either play defense and wait for a better opportunity or throw caution to the wind and hope that markets remained expensive. As our investors hopefully understand and appreciate, we prefer the former.
Our willingness to play defense earlier in the year allowed us to go on the offensive when valuations became more attractive this past March. The ensuing recovery in prices across stock, bond and real asset markets means that portfolios benefited from that shift in positioning. It is impossible to know how much further the current positive market momentum may carry things, but with valuations again stretched, we must avoid becoming complacent. We still believe pockets of opportunity exist but have begun to take progressively more defensive measures. Shifting to a more defensive stance is difficult to do when markets are moving higher, but as the legendary football coach Paul “Bear” Bryant once said, “Offense sells tickets. Defense wins championships”. As evidenced by this past February, we also know that the direction of the market can change rather abruptly.
Second Quarter 2020 Summary
At the March lows, equities and other risk assets appeared to be pricing in a moderate to severe global economic recession. While that outcome was (and still is) a real possibility, we believed prices had dropped to levels at which investors were being adequately compensated for that risk and added to our holdings in equities and other risk assets, such as corporate high yield. Our expectation at the time was that markets would continue to be volatile and perhaps take a considerable amount of time to recover, given the seriousness of the pandemic and the magnitude of the economic uncertainty and downside risks. Instead, investors who had been able to withstand the historic selloff enjoyed a sharp rally off the lows, particularly in equities. Over the course of just one quarter, investors got the equivalent of years’ worth of “normal” equity returns. As a result, markets now appear to be pricing in a rather optimistic scenario or path forward in relation to both the global economy and the ongoing pandemic. As previously communicated, we took advantage of the higher prices to reduce our equity exposure and sensitivity to overall market direction. We did not do this out of a sense of certainty as to the market’s near-term direction, but due to our valuation discipline and what that information told us about market expectations. At current prices and valuations, markets are no longer pricing in a moderate to severe downturn, but something much more optimistic.
It is entirely possible that this optimistic scenario could be realized, but it would likely require any second wave of infections to be manageable and, most importantly, the quick development of an effective and available vaccine. We certainly hope for this happy outcome and more market gains, but as every investment professional has at one time heard, “hope is not an investment strategy.”
The unfortunate reality is that the fastest vaccine ever developed took roughly four years and most take more than a decade. Again, it is entirely possible that the historic efforts being made by governments and drug researchers around the globe will shorten that timeframe, but it is far from a certainty. As your investment advisor, it is only sensible to consider the risks should this optimal outcome not come to fruition. After all, in the words of legendary investor Benjamin Graham, “the essence of investment management is the management of risks, not the management of returns.”
As always, each advisor at Smith and Howard Wealth Management is available and eager to answer your questions on these or other topics related to investments and financial planning. Please call us at 404-874-6244 or email us here.
For our brief overview of potential market-influencing matters for the second half of 2020, take a look at our video: On the Horizon.
Unless stated otherwise, any estimates or projections (including performance and risk) given in this presentation are intended to be forward-looking statements. Such estimates are subject to actual known and unknown risks, uncertainties, and other factors that could cause actual results to differ materially from those projected. The securities described within this presentation do not represent all of the securities purchased, sold or recommended for client accounts. The reader should not assume that an investment in such securities was or will be profitable. Past performance does not indicate future results.

Subscribe to our newsletter to get inside access to timely news, trends and insights from Smith and Howard Wealth Management.
 Back to Insights