ARTICLE
An In-Depth Look At The Markets Through The Third Quarter
by: Smith and Howard Wealth Management
Many investors, including this one, spent a good portion of the 3rd quarter waiting for a market pause or retracement of some of the impressive gains we saw during the 2nd quarter. That pullback, however, didn’t occur until early September and even four straight weeks of subsequent declines couldn’t upend a strong quarter for both stocks and bonds. For the year, while U.S. core bonds have been positive throughout 2020, they are now also joined by global equities after the two consecutive quarters of gains.
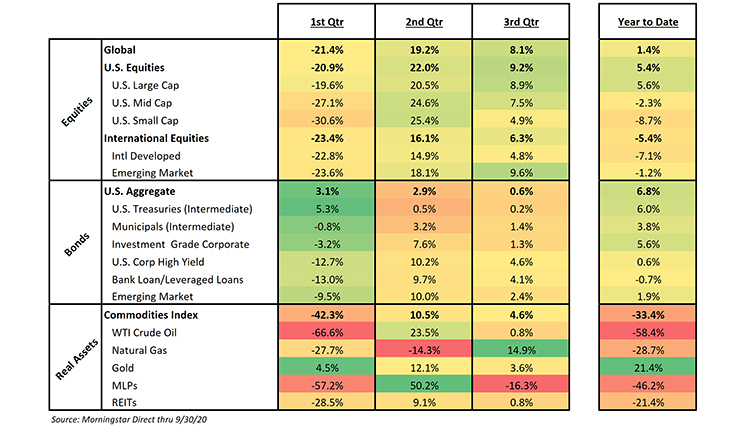
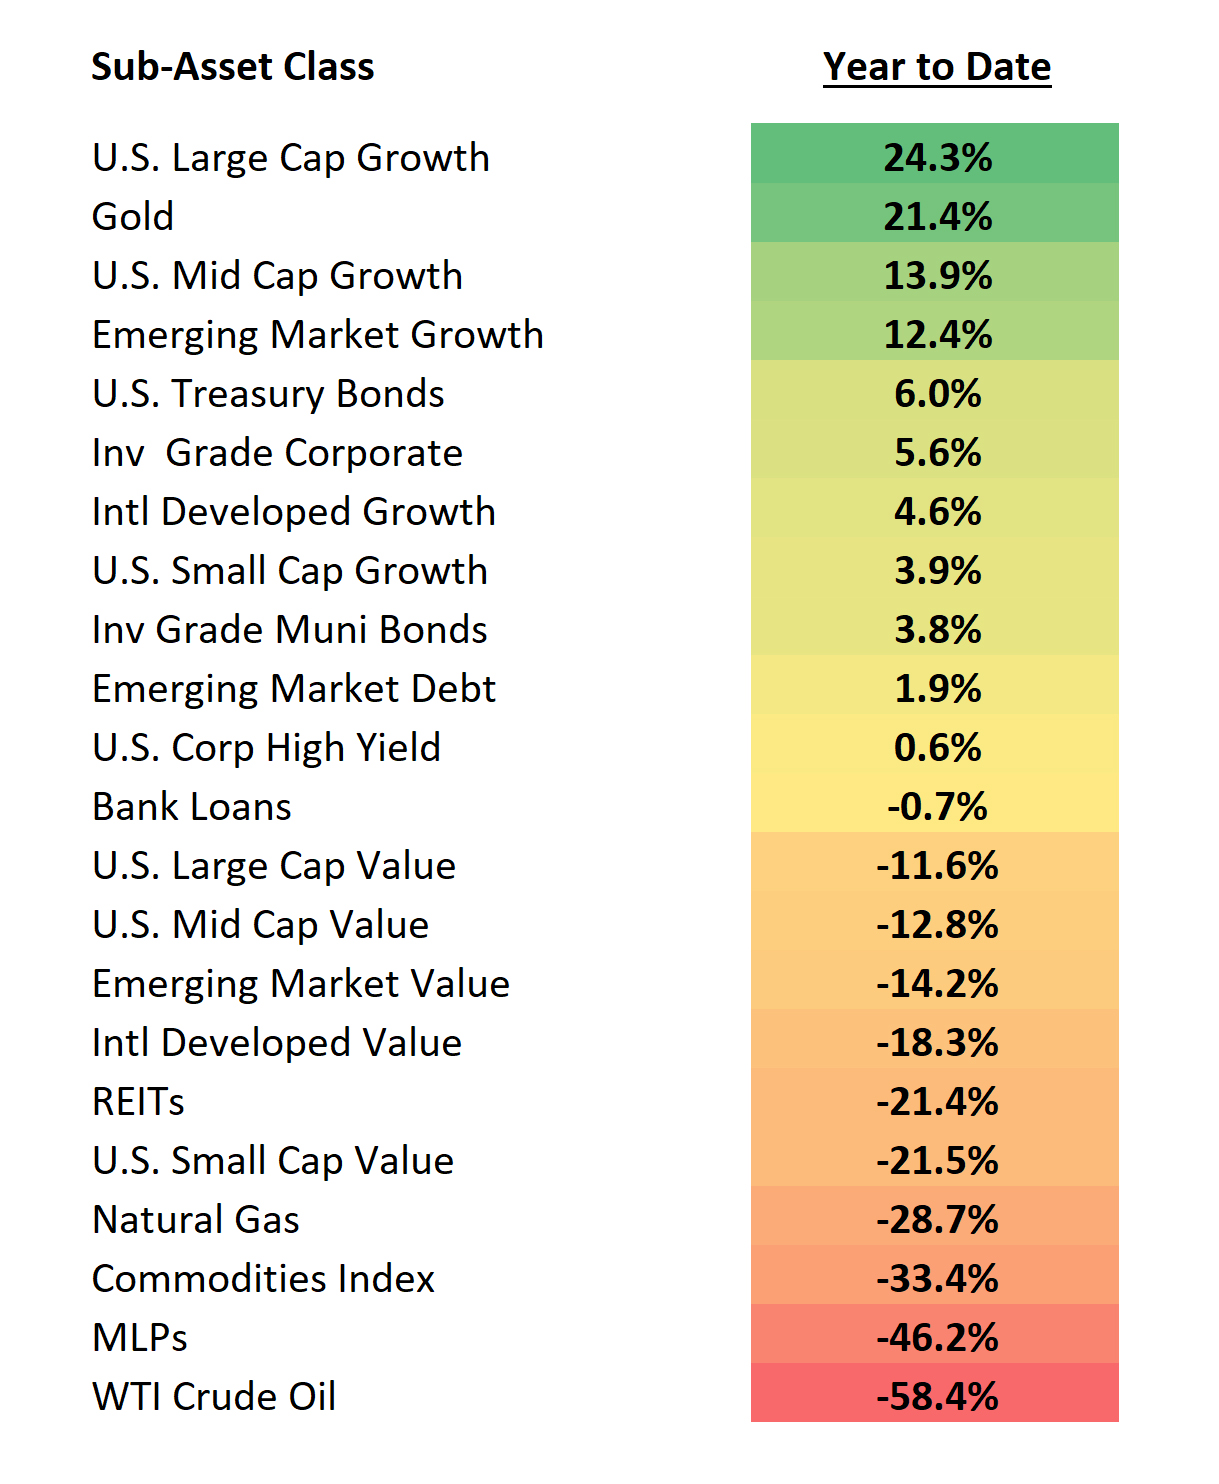
With equity markets turning positive for the year during the 3rd quarter, investors began to breathe a sigh of relief. Many also took the time to reassess what had transpired the past few months and better understand the source of that strength. One observation that we and others have commented on was that while markets have broadly rallied off the lows set in March, the areas of the market in positive territory is actually quite narrow. We’ll discuss this in greater detail as we review equities, bonds and real assets, but as the illustration below shows, the positive performance was only in growth stocks, high quality bonds and precious metals. Value stocks, lower credit quality bonds and most commodity markets remained firmly in negative territory.
Equities
Recap – Despite a roughly 10% selloff in equities during September, stocks continued to recover from the March lows during the quarter. Returns were certainly more modest than the outsized returns from the prior quarter, but they were solidly positive and across market caps and geographies. It has become increasingly hard to pinpoint specific catalysts for the ongoing rally, given that infection rates and trends related to the global pandemic have yet to wane, but investors appeared to remain optimistic that one or more vaccines currently in development will allow a speedy return to “normal” for the global economy and life in general.
While most major market segments remained negative for 2020, the global equity market, led by U.S. Large Cap stocks, did cross over into positive territory for the year during August. The September selloff was a bit of a spoiler, but the index remains +1.4% for the year. For the quarter, both U.S. and International markets broadly posted positive results, with Emerging Markets (+9.6%) and U.S. Large Cap Stocks (+8.9%) leading the way.
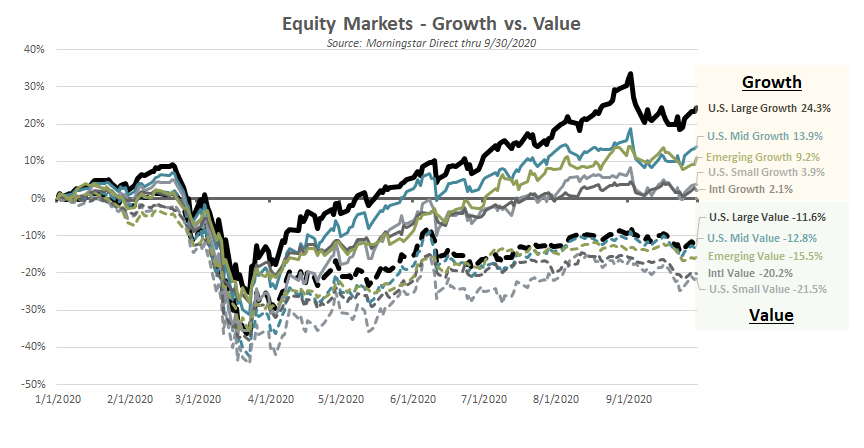
We’ve discussed the impressive performance of U.S. Large Cap Growth stocks in past write-ups, but the strength in growth stocks has not been restricted to just Large Cap. As the Equity Markets – Growth vs. Value graph shows, this strength in growth stocks may be most pronounced in the U.S. Large Cap space but it has really been a global theme. The lines are color coordinated, with the solid lines representing the growth segments of a particular market and the dotted lines of the same color the value segments. Growth has outperformed value across the board and in each case by a significant percentage.
Value today or value tomorrow?
The divergence between growth and value stocks brings to mind a quote from the venerable investor Howard Marks. In talking about the difference between value and growth styles, Howard wrote, “The choice isn’t really between value and growth, but between value today and value tomorrow. Growth investing represents a bet on company performance that may or may not materialize in the future, while value investing is based primarily on analysis of a company’s current wealth.”
Growth investing is therefore more of a leap of faith on the future. Placing bets on what the future might look like for the economy or a particular stock is obviously fraught with error and at times can lead investors to focus only on a company’s prospects or potential while ignoring price. History tells us, unfortunately, that while some companies will deliver on that potential, many others fail and their stock prices suffer as a result. For every Google, Apple and Amazon there are a larger number of stocks like Yahoo, JDS Uniphase, Redback Networks or Ask Jeeves that simply don’t pan out. Each of those companies no longer exists today, but businesses don’t have to outright fail to be poor investments. Cisco Systems is one such example. Cisco was a tech bubble darling that today remains a viable, profitable business. In fact, between 1999 and 2019, Cisco achieved impressive revenue growth of over 327%. One would normally expect that type of growth to translate to solid (if not spectacular) stock performance, but today the stock remains more than 50% below levels at which it traded at in late 1999. Why? Trading at an almost unthinkable 196x earnings in March of 2000, the expectations for growth and resulting profits had simply become unrealistic. Even mighty Microsoft, another tech company that flourishes today, saw its stock price languish for nearly a 15-year period post the tech bubble despite continued growth in revenues and earnings over the years.
Given the impressive recent performance of growth stocks, it is logical for investors to again wonder whether expectations have built to unrealistic levels. We do believe markets are expensive relative to history, but we also see a number of differences as it compares to the tech bubble. With that said, we see some potentially worrisome investor activity in certain segments of the market. One example is in the red hot market for electric vehicle stocks.
To be clear, the prospects for the electric vehicle market are tremendous. We think investors are right to be excited about the concept and potential, but the performance and extreme swings in the stock prices of some of the emerging players is an indicator of speculative trading rather than investing (in our opinion). An extreme example and one that has recently received a good bit of media attention is Nikola Corporation, an aspiring electric and hydrogen-based truck company. Despite not expecting to deliver its Badger electric truck to customers or have any source of revenue until 2022, the stock (ticker: NKLA) at one point had surged nearly 840%. At its highest point the company, which has no revenues, no finished product and is many years from turning a profit, had a larger market cap than Ford and nearly as high as General Motors, BMW and Honda. We should note that the stock has since come back down quite a bit after rumors surfaced that the company had fabricated some of its claims about the truck -including that they even had a working model!
Stories like that of Nikola happen from time to time, but it is noteworthy when it happens across an entire market segment. Other electric vehicle-focused companies also saw dramatic stock price increases, including the company most people are familiar with, Tesla. With a proven concept and production capability, Tesla is clearly at a different place than a company like Nikola. The question investors may need to start asking, however, is whether or not the stock price is simply expecting too much from the company. With a number of things going for it, Tesla may not go the way of Ask Jeeves, but could it be the next Cisco? To be clear, we aren’t individual stock analysts and we can’t know the answer to that question. Apple, Amazon and others have shown that, while it may be improbable, it is not impossible for companies to deliver on outsized growth expectations. Our point in looking at Tesla more closely isn’t to declare it overvalued but to illustrate just how much investors are reliant on the company meeting increasingly lofty growth expectations to justify the current stock surge and price.
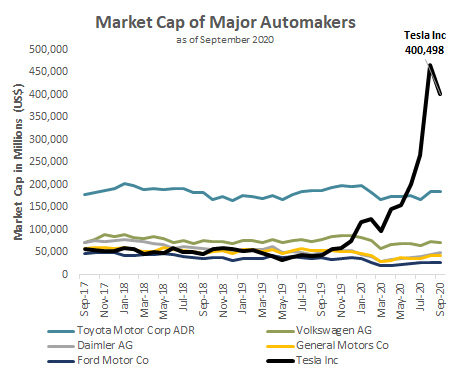
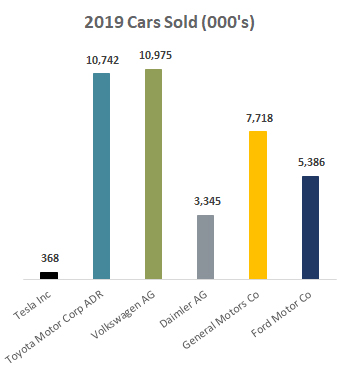
As this graphic shows, Tesla’s market cap is now more than two times the size of the next largest automaker, Toyota. This acceleration in the stock price and market cap started in late 2019, but it really took off in the spring of 2020 and then went hyperbolic this past summer. It is hard to rationalize such an extreme run when nothing truly significant has recently changed for the company. The vehicles themselves are well regarded and the market opportunity for the company is enormous, but both of those things have been true and acknowledged for quite some time. What changed?
The market cap graph is even more astounding when one considers just how few vehicles Tesla actually sells today. To be fair, Tesla has seen significant growth in vehicles sold per year and that growth is constrained less by consumer demand than their ability to supply the vehicles. Regardless, as the graph of cars sold in 2019 shows, Tesla remains a small player in the global auto market. The number is expected to grow to 500,000 in 2020, but at that rate it’ll take many years for them to catch or displace the big players. Tesla will also be attempting to make that leap in production and sales at a time when all the established players and several new entrants are coming to market with their own electric vehicles. As of August, Car and Driver Magazine expected 39 new electric vehicle offerings in the next few years.
To revisit our Howard Marks quote, “Growth investing represents a bet on company performance that may or may not materialize in the future.” Tesla may eventually grow into its current stock price, but clearly investors have placed a sizeable bet on tremendous growth that may or may not materialize. The recent moves in stocks like Nikola, Tesla and many others indicates that investors may be focusing too much on what may happen and disregarding the may not portion of that statement.
Investing in ideas, concepts or themes can be exciting and even profitable, but the laws of finance still apply. Price always matters and ignoring that basic principle risks repeating the mistakes of the past.
Outlook – The large differential in returns between growth and value stocks creates two very different return outlooks. Broadly, we find equity markets to be expensive, but as we drill down by style as well as market cap and geography we do see pockets of opportunity. Value stocks, smaller capitalization stocks and international markets have not had nearly the same recovery off of the March lows and are priced at valuation levels that are far more attractive than their growth counterparts.
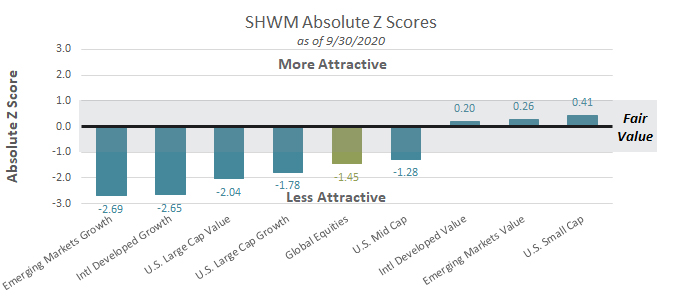
In our composite valuation scoring, we look at a mix of Price to Book, Price to Cash Flow, Price to Sales and Price to Earnings. Regardless of metric, the value, smaller capitalization and international segments stand out as the better relative opportunities. As our Absolute Z Scores illustration shows, however, none of the scores is meaningfully above 0, which means that there aren’t any real bargains. In layman’s terms, this is telling us that equities are broadly expensive, but some areas are markedly more expensive than others.
Bonds
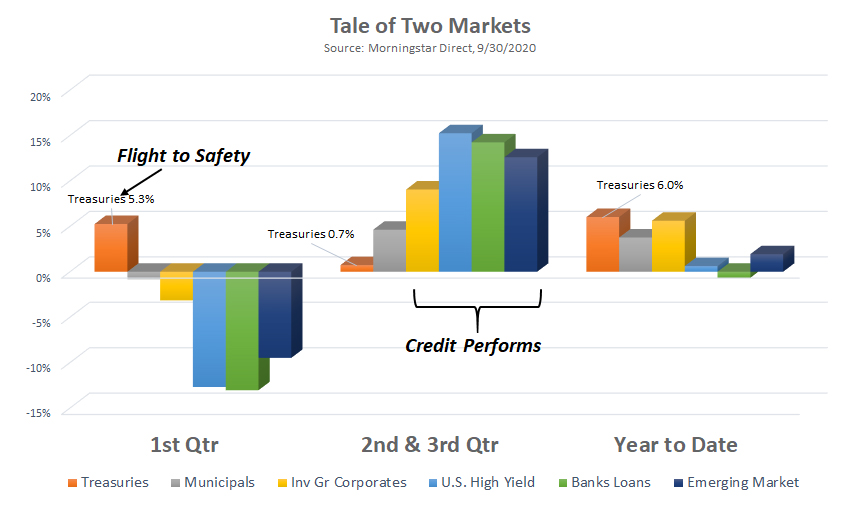
Recap – Similar to the 2nd quarter, investors were rewarded for their willingness to invest in the lower credit quality segments of both the investment grade and non-investment grade bond markets. The Bloomberg Barcap Aggregate U.S. Bond Index, made up of investment grade bonds, returned a modest +0.6% with Corporate bonds (+1.3%) outpacing U.S. Treasuries (+0.2%). The outpeformance of credit was more pronounced in the non-investment grade space as more impressive returns were achieved in U.S. Corporate High Yield (+4.6%), Bank Loans (+4.1%) and Emerging Market Debt (+2.4%).
Despite the strong returns of the last two quarters for credit-oriented bonds, they remain behind U.S. Treasuries and the broader index for the full year. In fact, while investment grade bonds are now solidly positive on the year, non-investment grade bonds in the U.S. remain somewhat mixed for the full year.
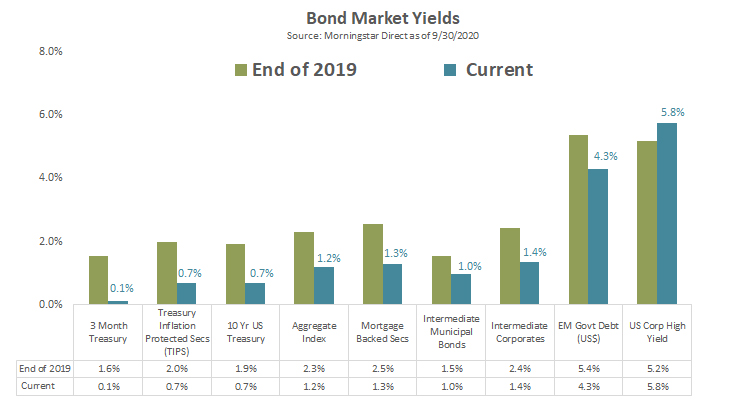
Outlook – While there are significant differences in the outlook for equities by style, market cap and geography, the same can not be said for bonds. Current yield levels vary by credit quality, of course, but nearly all segments of the bond market now have yields that are below where they stood at the end of 2019. Only U.S. Corporate High Yield remains higher. That is illustrated in the accompanying Bond Market Yields graph, in which the green bar shows the yield as of 12/31/19 and the blue bar the yield as of 9/30/20. We stated at the end of 2019 that we believed bonds to be expensive, so it should come as no surprise that we again have come to that same conclusion.
The non-investment grade credit portion of the market, something we often refer to as Opportunistic Fixed Income, is one in which we remain active. After cutting our exposure in January, we used the higher yield levels available in early April to add this exposure back to portfolios. With those bonds surging again the last few months and yields dropping we have again started to reduce this Opportunistic Fixed Income exposure.
Real Assets
Recap – The story in real assets, in particular commodities, is similar to the narrative that we described in the equity and bond markets. Performance has been broadly or mostly negative, except for a particular market segment. In equities, that segment was growth stocks. In bonds, U.S. Treasuries and other high quality debt. In the case of commodities, that segment has been precious metals – specifically gold and silver.
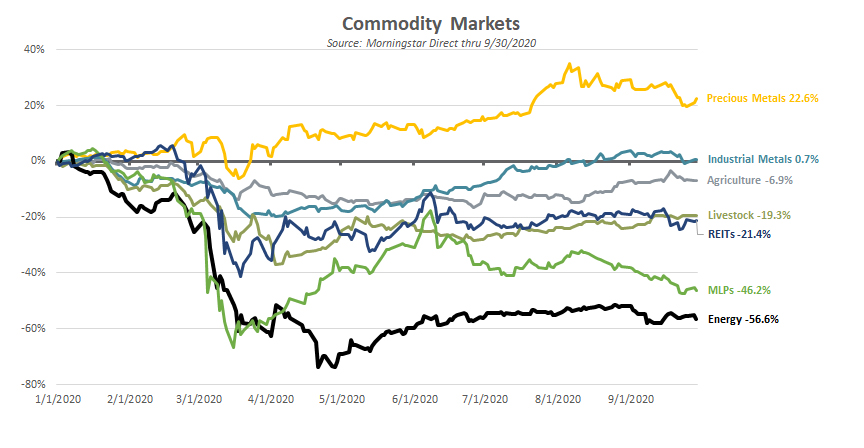
The appeal of precious metals during the March selloff was not particularly surprising. Gold, as well as silver, have historically acted as stores of value or safe assets during periods of market stress. What is somewhat surprising is that gold has continued to attract capital, perhaps from investors who still fear the worst, even as other markets and the economy have started to recover. Gold remains, along with U.S. Treasuries, the only sub asset class component of our Return Heat Map to post positive results in all three quarters of 2020. As as result, the accompanying Commodity Markets graph shows Precious Metals as the only meaningfully positive segment on the year. In fact, several real asset markets like energy, MLPs, REITs and Livestock remain significantly down for the year.
Outlook – At Smith and Howard Wealth Management, we don’t typically invest directly in commodities. Commodities themselves do not pay interest or produce a cash flow, making them difficult to value or invest in directly. We will, however, invest in commodity-related businesses and allow our managers the flexibility to invest in such areas. One of our international equity managers, as an example, typically owns gold and gold stocks and has benefitted from the performance of each this year. Real Estate Investment Trusts (REITs) and energy pipelines (often referred to as MLPs) are two areas that we continue to monitor and believe can be part of a long-term solution or component of a portfolio. Our current views on each differ, however. We believe REITS, despite their negative year-to-date returns, still do not warrant a specific or special allocation at current valuations. REITs are already included in broader equity indices, so we do have exposure already through other holdings. Energy pipelines have also been hard hit by the downturn, but are priced at levels we find attractive. They trade at historically low multiples of cash flows and earnings and many have dividend yields in the high single digits.
Summary

After an exceptionally strong 2nd quarter that saw markets recoup much of their early year losses, it would not have been at all surprising to see markets pause or even give back some of those gains. Fortunately for investors, the pullback that did finally occur in September was not nearly enough to stop most major equity markets from posting positive quarterly results. The upward trend, however, does leave us again in the precarious position of questioning whether markets are too quickly dismissing the potential for future market disrupting developments or events – a longer than expected period before an effective vaccine can be found or distributed, a contentious and drawn out U.S. election cycle, or simply the lingering effects of the coronavirus on global economic growth.
As our investors know, we don’t focus our efforts or process around trying to actually predict such events or outcomes. Rather, we believe investors should focus on valuations and what those valuations may be telling us. As one of our equity managers recently stated, “Valuation is a measure of the margin of safety in an investment and that margin has started to feel pretty slim again.”
It is impossible to eliminate investment risk, but we can aim to ensure that we are being adequately compensated (by way of future returns) for the risks we are taking. As markets continued higher during the quarter and our margin of safety continued to shrink, we became progressively more defensive in portfolios. While it remains entirely possible that the financial markets optimism will prove correct, our role as your trusted financial advisor is to not simply rely on that hope.
As always, each advisor at Smith and Howard Wealth Management is available and eager to answer your questions on these or other topics related to investments and financial planning. Please call us at 404-874-6244 or email us here.
For our brief overview of potential market-influencing matters for the third half of 2020, take a look at our videos: On the Horizon and Deeper Dive.
Unless stated otherwise, any estimates or projections (including performance and risk) given in this presentation are intended to be forward-looking statements. Such estimates are subject to actual known and unknown risks, uncertainties, and other factors that could cause actual results to differ materially from those projected. The securities described within this presentation do not represent all of the securities purchased, sold or recommended for client accounts. The reader should not assume that an investment in such securities was or will be profitable. Past performance does not indicate future results.

Subscribe to our newsletter to get inside access to timely news, trends and insights from Smith and Howard Wealth Management.
 Back to Insights