After a solid start to the quarter, the month of September proved challenging once again. The media has taken to dubbing market weakness during the month of September as the “September effect” due to it being statistically the weakest calendar month historically for equities. Interestingly, during this past September, bonds were also weak. Like most market anomalies (remember the Super Bowl indicator?) the tendency for weaker results during the month is considered a historical quirk in the data rather than an effect with any causal relationship. Regardless of the reason or correlation, the final month of the quarter was a meaningful drag on results for stocks and bonds.
September effect or not, there were two more fundamental reasons for the recent weakness. The first was the ongoing worries regarding a large Chinese property developer, Evergrande, that is facing a significant liquidity crunch. Debt and cash flow issues have plagued the company for months, but market angst has grown as the company has been unable to resolve those issues, and the Chinese government has declined to publicly commit to restructuring or bailing out the company. Most market participants ultimately expect that even if the Chinese government lets Evergrande fail they would intervene to limit or stem any contagion effects to the broader Chinese and global markets.
The other driver during the last month was renewed concerns regarding inflation here in the U.S. and what actions the Fed may take as a result. While the Fed has maintained their belief that the current inflation surge will abate in time, they have nonetheless started down a path that will remove much of the quantitative easing that was put in place during the pandemic. The removal of these measures is presumed by most to put upward pressure on interest rates and bond yields. Since many investors believe today’s high equity prices and valuations are a direct and inverse result of low interest rates, it is understandable that those same investors would expect a move higher in interest rates to put pressure on equity prices and valuations.
Despite the lackluster end to the third quarter and negative fixed income returns on a year-to-date basis, investors have benefitted from strength in the equity market for the full year-to-date period. Double digit gains in global equities have allowed most investors to remain in positive territory overall to this point.
Equities
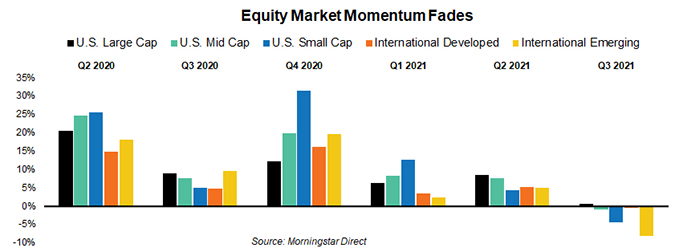
Recap – After surging off of the March 2020 pandemic lows, global equity markets enjoyed several truly impressive quarterly returns through the remainder of 2020. Fortunately, equities maintained that momentum into 2021, although at a bit more modest pace. Perhaps just as notable as the returns and their momentum was the overall breadth of returns. U.S. equities across all market capitalizations (sizes), as well as International Developed and Emerging Markets stocks, all experienced five consecutive quarters of strong returns. In fact, the weakest quarter during that period for the global equity market was a +4.6%, which if annualized would be just shy of +20%! That is incredibly remarkable given the divergence in global vaccination rates and the varied pace of economic reopenings.
Alas, the market momentum finally ran out of steam. Fortunately for investors, markets were only down slightly. Investors will now be anxiously looking for any signals that indicate whether the pause in returns is temporary or the start of a new, less profitable trend.
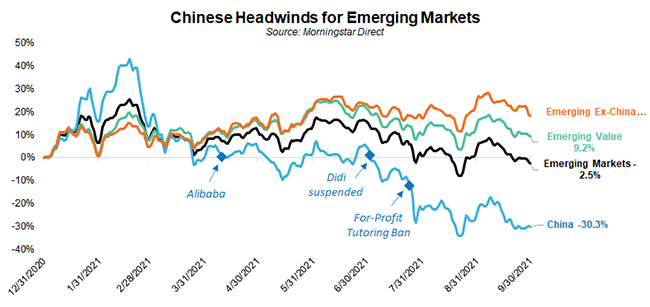
While most major equity segments remained relatively close to breakeven, there was one notable underperformer – Emerging Markets. That weakness can be attributed almost entirely to China. China accounts for more than a third of the emerging market index, so weakness in that market has a significant impact on overall results. Surprisingly, the aforementioned issues with Evergrande have not really been the driver of the weakness. The larger issue for Chinese stocks has been a regulatory crackdown by the government on its technology sector. That campaign kicked off in earnest in April when Chinese internet giant, Alibaba, was fined $2.8B. Then, in July the government suspended the popular Chinese app Didi for violating data security protocols and also banned for-profit tutoring.
Weakness in Chinese stocks over the last two quarters has pulled down overall emerging market returns. Returns for emerging markets excluding-China or focused on value stocks has actually continued to be quite positive. To be fair, we are obviously looking at a rather short time period. Longer time periods would actually show that Chinese stocks, despite their recent weakness, have been a meaningful outperformer within the emerging markets space.
Outlook – different numbers, same theme
Our long-term outlook for equities remains essentially unchanged. Future returns are likely to fall short of what investors have come to expect or the market has historically averaged, but they still provide reasonable upside compared to bonds.
Comparing current stock market valuations to their historical levels and averages, for virtually any metric, yields the same observation – they are as expensive today as they have ever been except for during the tech bubble. That’s the negative and it’s not an insignificant one, especially for a valuation oriented investor such as ourselves. Why are we not more negative or cautious given the high valuations and comparisons to periods like the tech bubble? We’ve discussed it before, but there is one major difference between today and the height of the tech bubble – interest rates / bond yields.
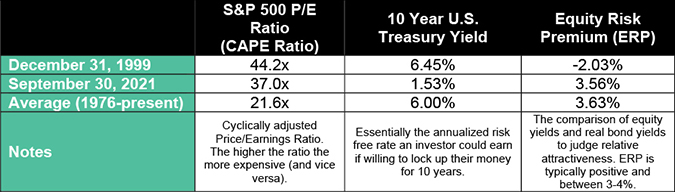
Using the S&P 500 as a proxy for the overall stock market, the table below shows that while the S&P 500 is expensive today compared to historical averages it remains below the lofty heights reached during the tech bubble. As noteworthy as that is, we find the difference in the 10 Year U.S. Treasury Yield to be even more remarkable.
It seems hard to fathom today, but at the height of the tech bubble investors were willingly forgoing an opportunity to earn 6.45% in a U.S. Treasury bond to buy stocks at multiples never seen before (or since). In fact, the Equity Risk Premium at the time was actually negative! The point being that investors had a rather attractive alternative to buying high priced stocks. The same can’t be said today. With a 10 Year U.S. Treasury yielding just 1.53%, below the current rate of inflation, the alternative isn’t all that compelling. For investors looking to actually make money after inflation, equities now appear to be “the only game in town”.
Again, we understand and agree with investors who believe equity markets are expensive or even inflated. Based on their own history that is hard to argue. What is more reasonable to argue is that compared to bonds or inflation, stocks still present a reasonably attractive return.
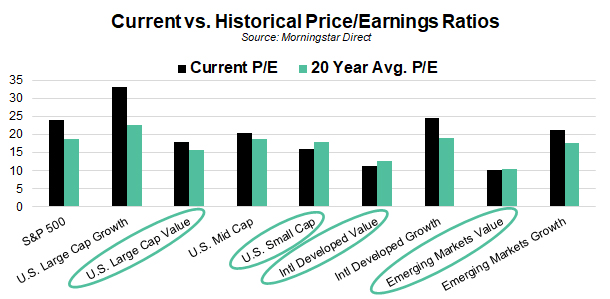
Another reason we’re reluctant to get too cautious or negative on stocks generally is simply that valuations are not uniform across the globe or even within the U.S. We typically use the S&P 500 as a proxy for the overall stock market due to its long history and investors familiarity with it, but in reality the S&P 500 encompasses only a portion of the opportunity set that we analyze. That broader opportunity set reveals more attractive valuations in value, smaller capitalization, and international stocks, both developed and emerging. We wouldn’t necessarily say any are truly “cheap”, but several are at least closer to historical valuations and therefore more likely to generate returns closer to their historical norms.
Bonds
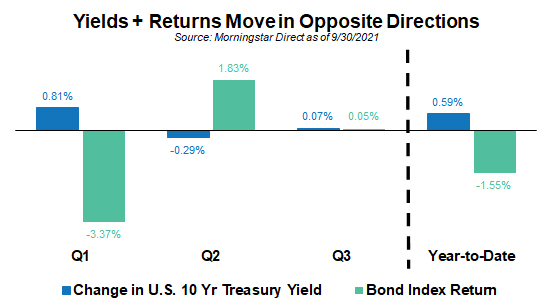
Recap – After a difficult first quarter of 2021, the Bloomberg Barcap Aggregate U.S. Bond Index has managed to recover some of the ground lost over the last two quarters. During the most recent quarter the index eked out a gain of +0.05% and remains down -1.55% year-to-date. As a result, the index has just one quarter left to return to positive territory and avoid what would be only the second negative calendar year for the index since 1999 (2013, -2.0% being the other).
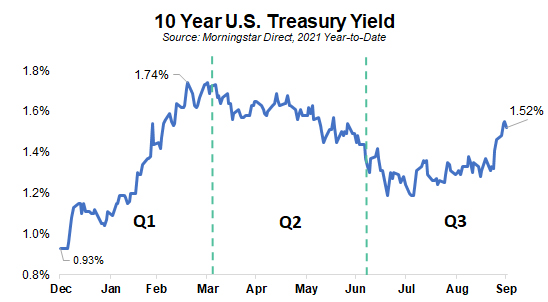
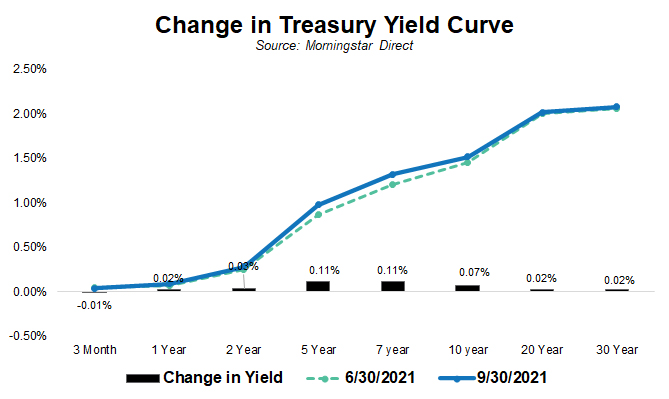
Tightening credit spreads have helped cushion some of the downside this year for bond investors, but that impact has not been enough to offset the overall shift higher in bond yields. As the following graphs show, the move higher in bond yields was concentrated in the first quarter of 2021 as the 10 Year U.S. Treasury yield jumped from 0.93% to a high of 1.74%. Since bond yields typically move inversely to bond prices this resulted in negative performance. In fact, the first quarter return was the worst quarterly loss for the index in over 40 years! After yields surged higher during the first quarter, overall yields have spent most of the last two quarters drifting slightly lower and producing modest, but positive, returns.
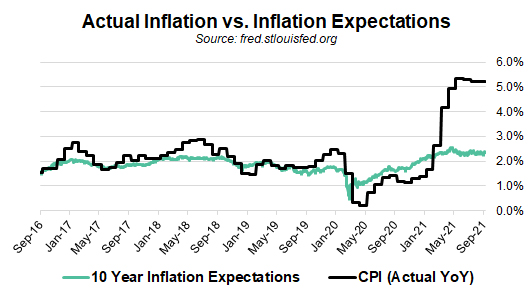
The reason for that early year surge in yields can be traced to an uptick in inflation expectations. As the global economic reopening progressed it became apparent that disrupted supply chains, labor shortages and pent-up demand from consumers would result in a meaningful increase in inflation data. While economists had generally expected inflationary pressures as economies reopened, the pace and the level of inflation readings gave the market a new worry – would the pressures be temporary or something “stickier” or longer lasting?
The bond market has been in “wait and see” mode now for much of the last two quarters. As our graph shows, actual inflation data (black line) has remained high, while future inflation expectations (mint green line) have remained fairly steady since the rise early in the year.
Inflation optimists and pessimists alike generally acknowledge that recent inflation readings, while noteworthy, are not evidence or confirmation that inflation will remain high. The next few quarters, however, are expected to give us a better gauge or reading on whether inflation will return to pre-pandemic levels or whether it will remain stubbornly high. To this point the Fed believes that inflationary pressures will abate as time passes. Even with that view, however,the Fed has begun discussing their plan to remove some of the monetary easing that was enacted during the worst of the pandemic. The “stickier” inflation appears to be the faster they are likely to remove those measures.
For now, investment grade bonds remain mostly negative on the year as investors await more inflation data and the Fed’s response. Non-investment grade bonds that are more heavily influenced by changes in credit spreads,which have been a positive datapoint year-to-date, have continued to enjoy a performance advantage with U.S. Corporate High Yield (+0.9%) and Bank Loans (+1.1%) outperforming for the quarter and year.
Outlook – As the change in Treasury Yield Curve graph shows, changes in yields for high credit quality bonds during the quarter were not overly meaningful. Credit spreads did widen slightly, but again the move was not enough to change our return outlook. For context, despite the move higher in spreads the U.S. Corporate High Yield spread ended the quarter at just 2.5%, which is a far cry from the much more attractive 8.7% level it finished at in March of 2020. With rates low and credit spreads narrow, we remain cautious and positioned defensively. We should point out that our defensive posturing is solely a function of valuations and an asymmetric risk to reward payoff. Credit fundamentals, in fact, remain quite positive and supportive.
Real Assets
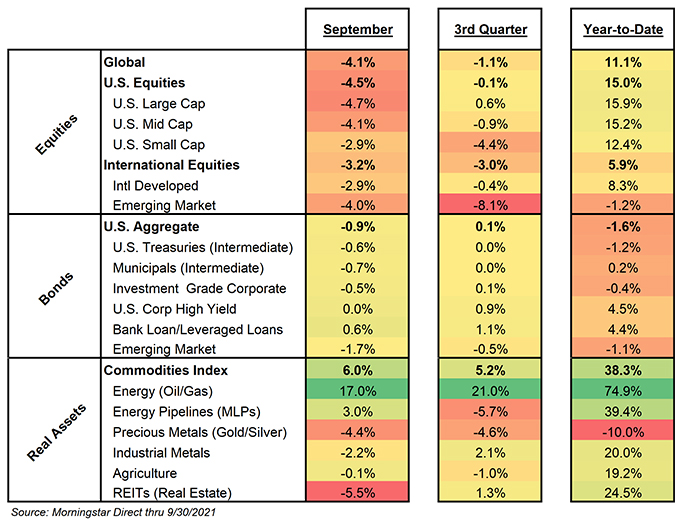
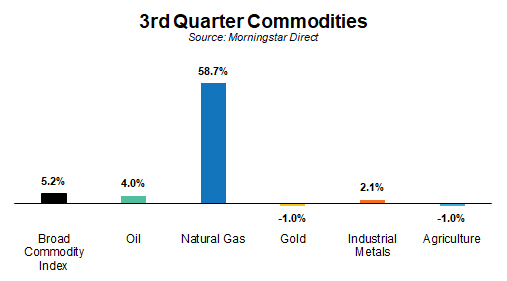
Recap – As our market “heat map” illustrated, real assets, consisting primarily of commodities and commodity related stocks, saw a fair bit of divergence in returns during the quarter. The overall commodities index, as measured by the S&P GSCI index, returned a solid +5.2% for the quarter; however, returns in several of the underlying components included a few small negatives. Precious metals and agriculture lost ground while strength in industrial metals and energy were enough to push the index higher.
Our market “heat map” captured the overall strength in energy commodities, but it doesn’t reveal the real outlier for the quarter – natural gas. While oil prices moved modestly higher, natural gas prices surged more than 58% over the last three months! What is perhaps even more remarkable is the price for gas (measured in $’s per million BTUs (British Thermal Units)) ended the quarter at $5.86 more than 280% higher than the pandemic low point of $1.54 in June of 2020. Commodity prices, like natural gas, are notoriously volatile, but higher prices may persist due to inventory shortages that will be tough to reverse as we head into the typically high demand winter season and production growth remains low.
Outlook – At Smith and Howard Wealth Management we don’t typically invest directly in commodities. Commodities themselves do not pay interest or produce a cash flow, making them difficult to value or invest in directly. We will, however, invest in commodity related businesses and allow our managers the flexibility to invest in such areas. One area in which we have allocated capital to in the past and retain a stake in today is Energy Pipelines (often referred to as MLPs). Most investors associate energy pipelines with the oil market, but the majority of volume that flows through pipelines in the U.S. is actually natural gas. Higher natural gas prices did not translate to higher energy pipelines stock prices during the quarter, but the longer inventory shortages and higher prices persist the greater the value of those pipeline assets. Our view on pipelines is rooted in its attractive valuation, but it’s always encouraging to see dynamics that may attract new capital to the space and push valuations (and prices) higher.
As always, each advisor at Smith and Howard Wealth Management is available and eager to answer your questions on these or other topics related to investments and financial planning. Please call us at 404-874-6244 or email us here.
Our video segment, On The Horizon, highlights government spending, the debt ceiling and inflation. To read our third quarter Market Summary, click here.
Unless stated otherwise, any estimates or projections (including performance and risk) given in this presentation are intended to be forward-looking statements. Such estimates are subject to actual known and unknown risks, uncertainties, and other factors that could cause actual results to differ materially from those projected.The securities described within this presentation do not represent all of the securities purchased, sold or recommended for client accounts. The reader should not assume that an investment in such securities was or will be profitable. Past performance does not indicate future results.
Want to get insights right to your inbox?
Subscribe to our newsletter to get inside access to timely news, trends and insights from Smith and Howard Wealth Management.
 October 5, 2021
 Back to Insights